Op 16 januari was Nederland weer eens bedolven onder een laag sneeuw. Zo een 40 mensen – waaronder ik – trotseerden het winterse weer om af te reizen naar...
Tableau is your ultimate tool for turning data into insightful visualizations. When it comes to spatial data, it certainly won't let you down. Whether you...
A dashboard that looks different based on the time of day? A beautiful starry sky in the evening, and a clear mountain peak during the day. How cool would it be...
The Tableau Conference 2023 is in full swing. One of the highlights of the conference is the Keynote. In it, a section is reserved for Devs on Stage. Developers of...
The Tableau Conference is an annual event that brings together data enthusiasts from around the world to share knowledge and insights about data analytics. The conference is often held in Las...
Tableau Desktop is a powerful data analysis and visualization tool widely used in the business world. However, it can be intimidating to begin using...
As organizations grow, managing and analyzing data becomes increasingly complex. Tableau offers two data visualization solutions: Tableau Server and Tableau Cloud. Although both platforms offer virtually the same functionality,...
First, congratulations on completing the Tableau Desktop 2 training! This is an important milestone in your journey to becoming a Tableau expert. To get into the right...
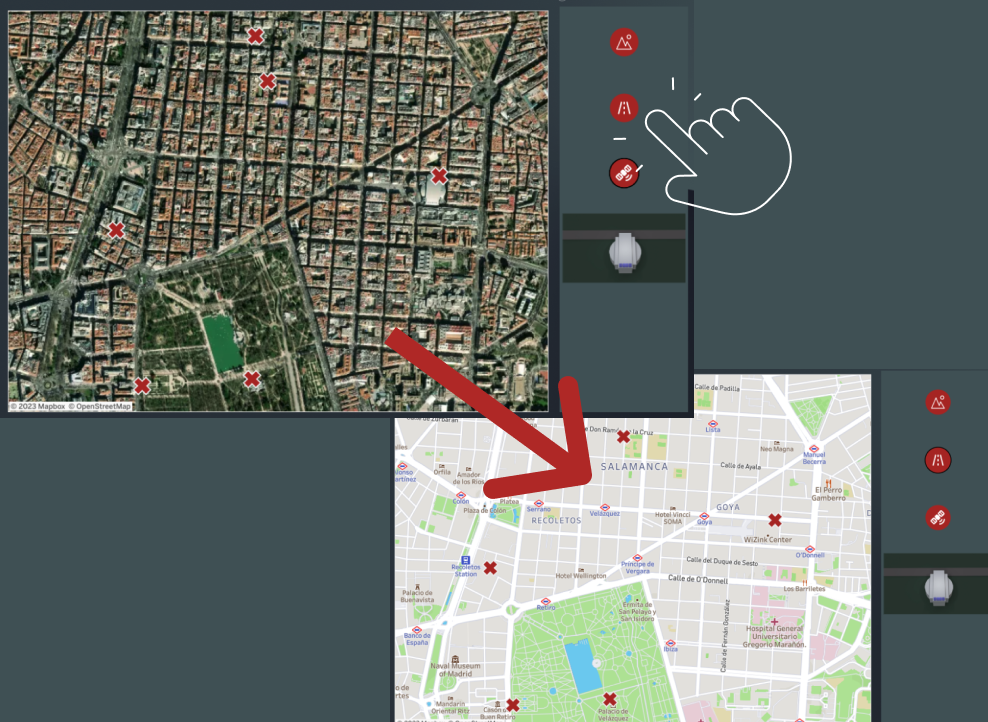
Introduction Tableau is a powerful data visualization tool used by organizations around the world. A new, lesser-known feature in Tableau is the Dynamic Zone Visibility feature. This...


