
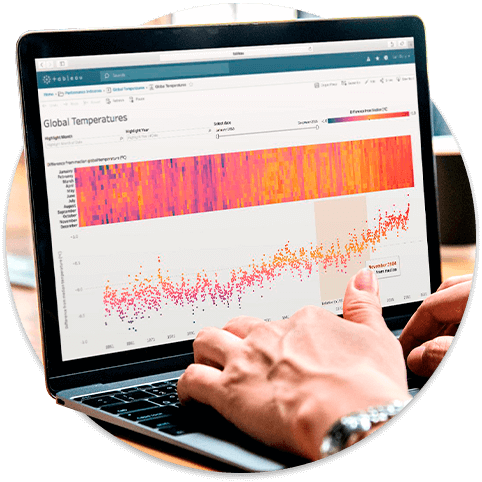
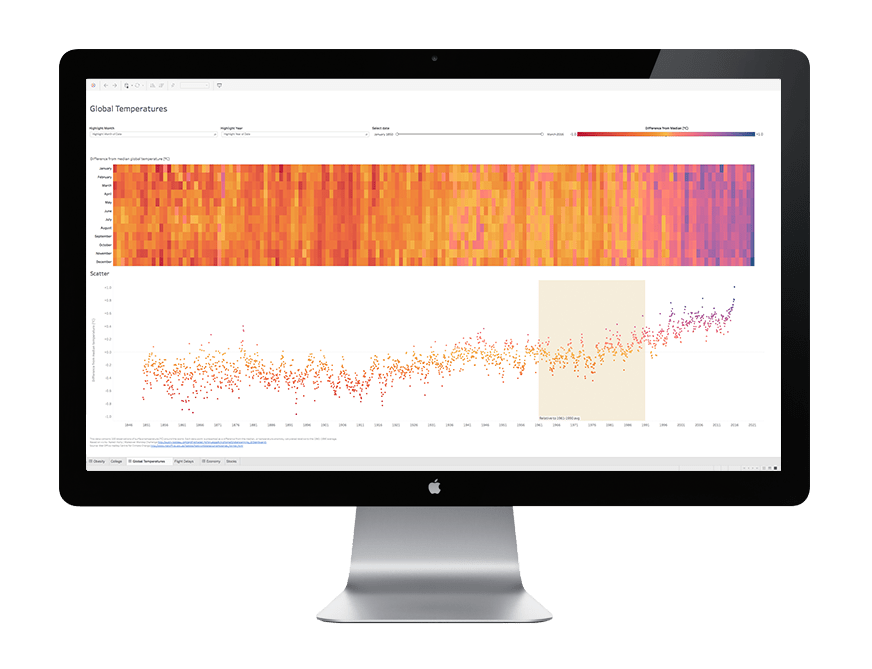

My Favourite Tableau (Design) Tricks From TC24
It has been a little over a month since I attended this year’s Tableau Conference in sunny San Diego. It was my first time experiencing the conference in all its
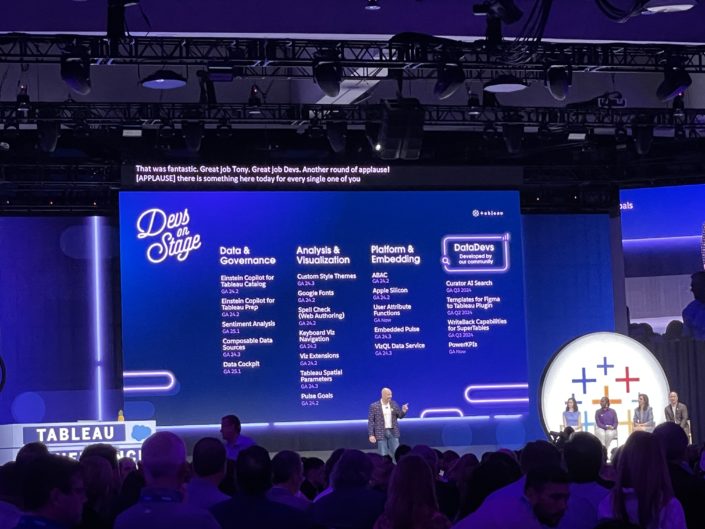
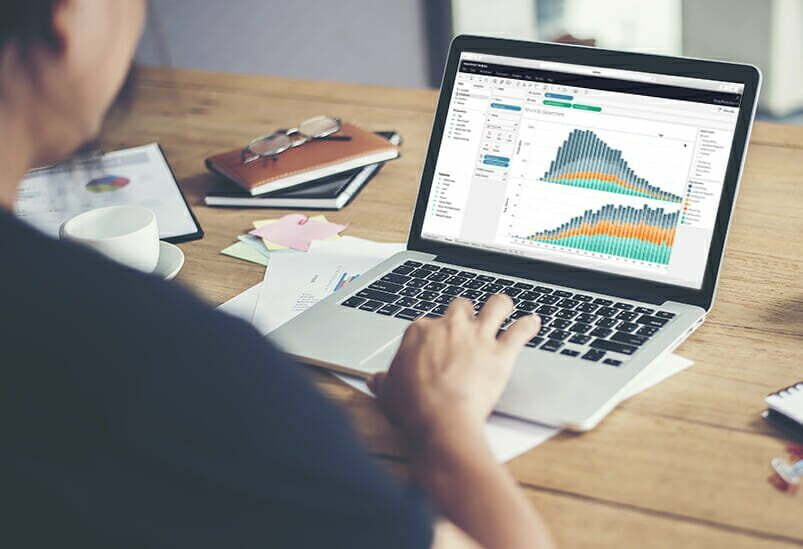
Tableau Conference ’24 – A quick Summary
It took me a while to be able to experience the Tableau Conference, to be precise almost 9 years! But finally I made it and I could not hope for

Tableau Pulse is Out! Here is What You Need to Know:
Introduction Tableau Pulse, a newly released tool belonging to the Tableau AI suite, transforms the way analytics are consumed by introducing an intelligent and tailored data experience. It stands out