

Data collection, linking and preparation are not new terms for organisations these days. We have probably all started to visualise this collected data without actually doing it.
From 14 to 17 October, I attended Alteryx's Inspire Europe 2019 event in Tobacco Dock, London. Although it was only my first Inspire,...

With the results window, you can quickly and easily view the data in your workflow in Alteryx Designer. Since version 2019.2, the results window in Alteryx Designer is more interactive...
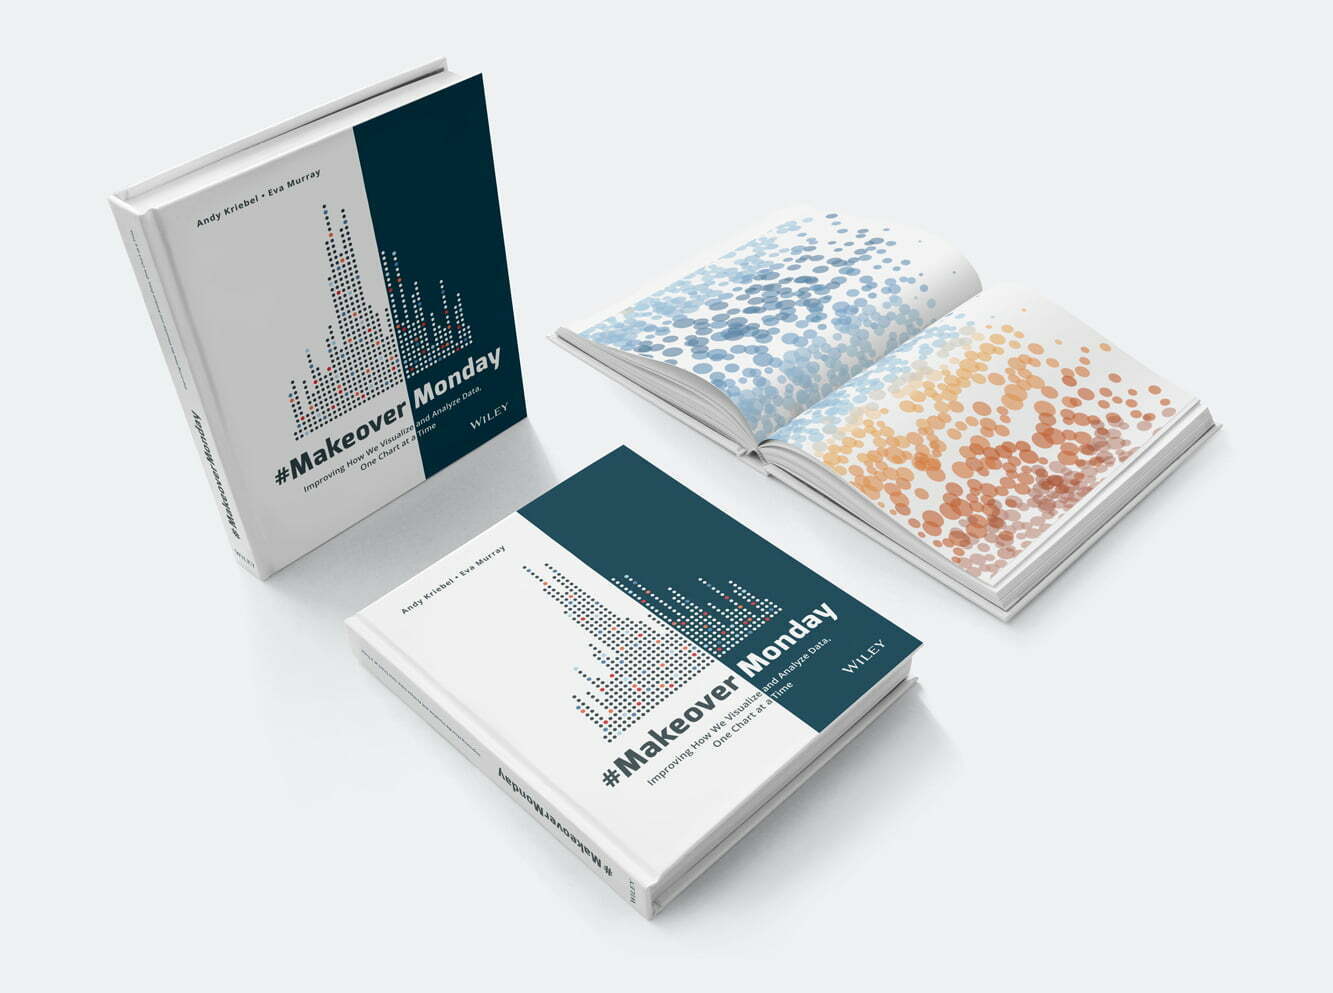
#MakeOverMonday is a concept in the data world. What is Make Over Monday? The idea behind #MakeOverMonday is to give an existing visualisation a Make Over. This visualisation...

The Big Data Expo 2019 was again a great success. We spoke to literally hundreds of people at the shared stands of Tableau and Alteryx. Many questions were about what...

Many of our customers use Tableau Server visualisations in their own customer portal. They do this by embedding Tableau visualisations in their existing customer environment whereby the authentication...
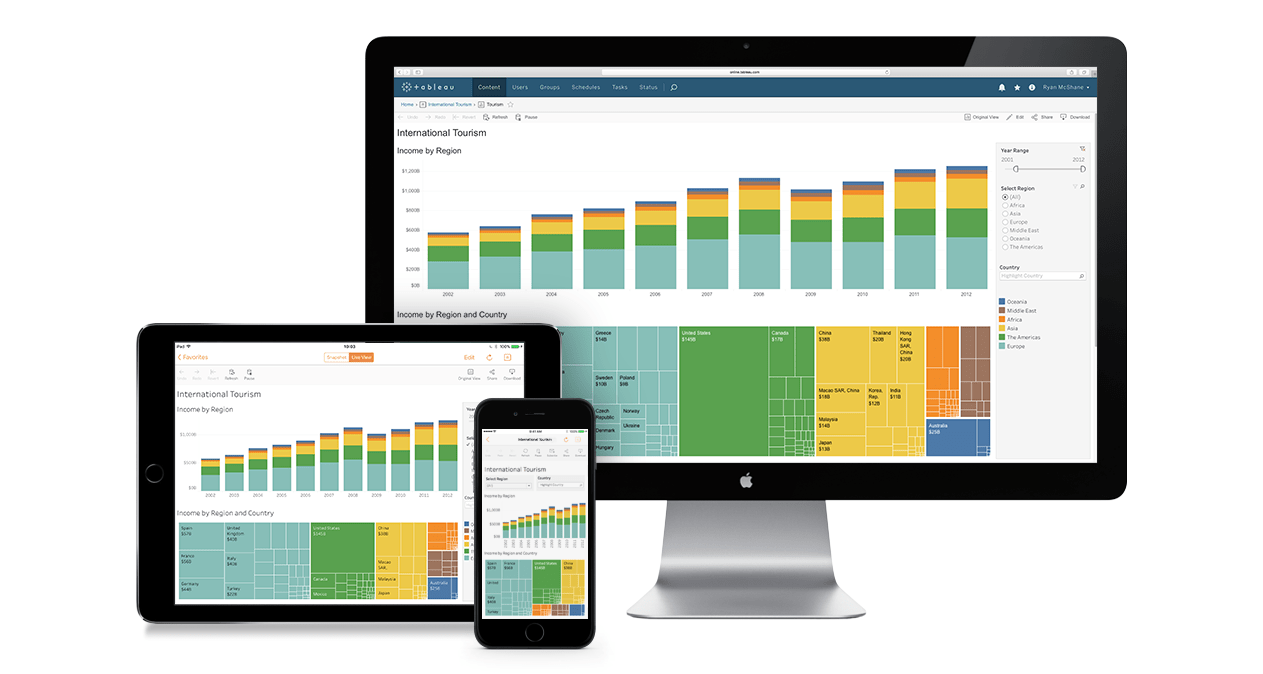
Tableau Web Editor is gaining functionality that is present in Tableau Desktop. However, there are still differences. In the following 2 Tableau Dashboards, created by colleagues Andrew Pick...
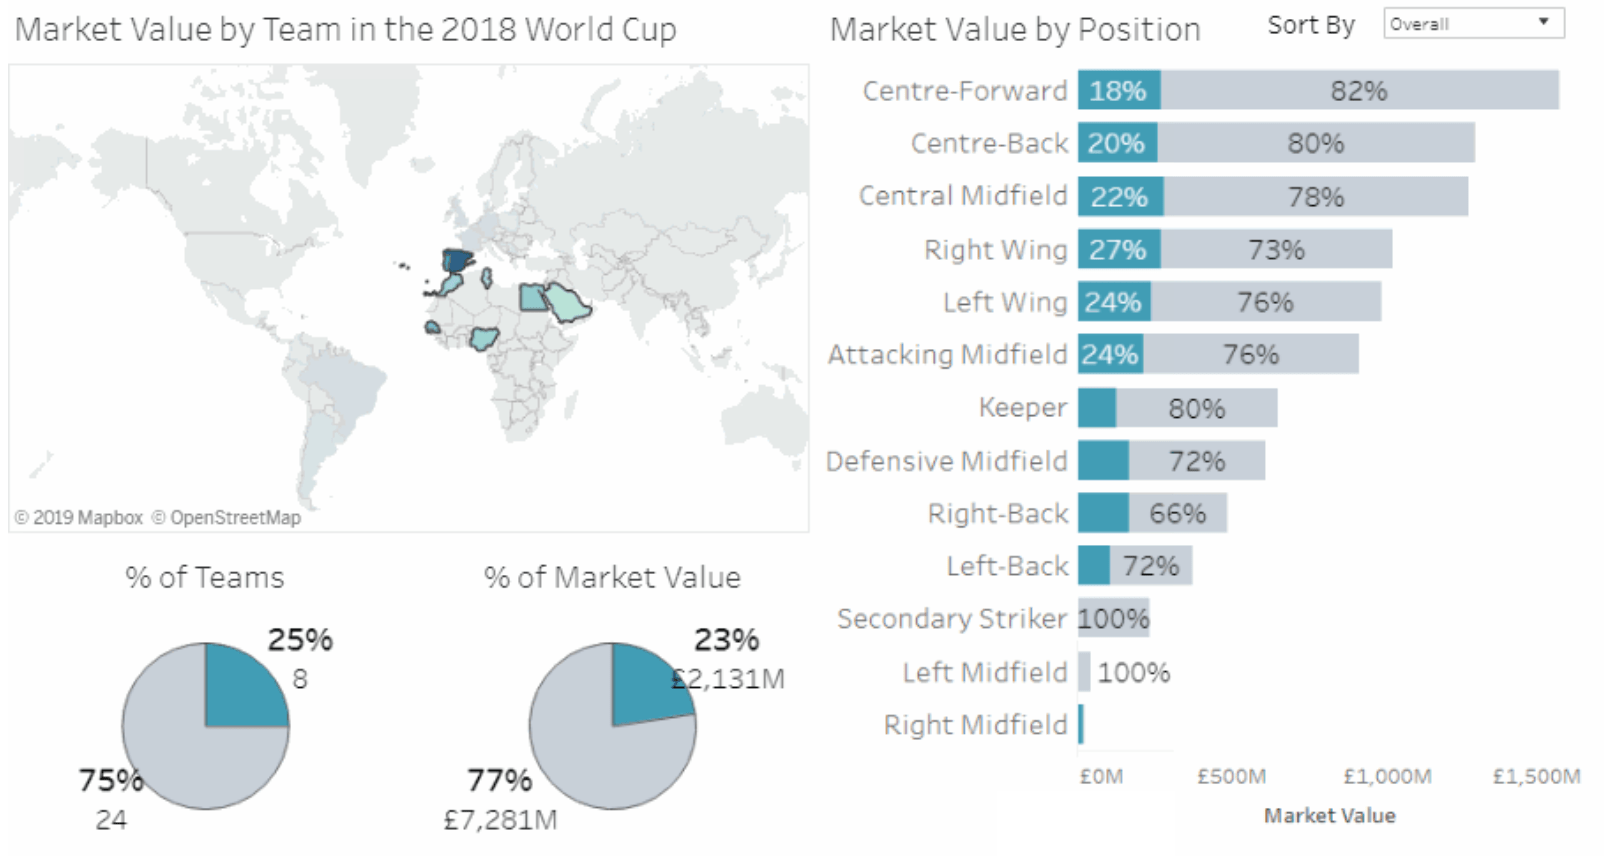
With the introduction of Tableau 2018.3, one term in particular buzzed through the Tableau community: set actions. Everyone was (and still is) excited about the infinite number of possibilities...
Do you have a Tableau dashboard in which you show data per week? Chances are that with the transition to the new year, the week numbers are not quite right anymore. As you...