Cordaan

Challenge
Cordaan wants to provide even better quality of care to its clients, be a good employer for its employees and remain financially healthy. These goals will be achieved in part by making accessible and smart use of high-quality data. This will lead to more and better insights for employees and thus to better decisions and performance.
Solution
Implementing a self-service cloud data platform. Unlocking, storing, modeling and visualizing the data and training the BI team and users.
Result
Cordaan is now able to make informed decisions based on accurate and reliable data, contributing to good employment and quality care.
Cordaan
Industry:
Care
Services:
Digitale transformatie
Cloud Data platform
Consultancy
Detachering
Training
Technology:
Snowflake
Fivetran
Tableau
dbt
Cordaan's vision
To cope with all current and future developments, Cordaan has the desire to grow into a more data-driven organization. Cordaan is convinced that organizations that make decisions based on facts and figures are well positioned to bridge the gap between the needs of the client and the services of the organization itself. The smart use of good quality data leads to more and better insights and therefore to better decisions and performance.
Cordaan wants to use data & analytics not only to be able to explain what happened, but also to predict outcomes. The insight gained from the analyses will be used to initiate actions and make timely adjustments. This will enable Cordaan to provide better quality care to their clients, be a good employer for its employees and remain financially healthy.
It is important that employees have a say in how information is displayed. This has been one of the reasons to go for a self-service solution that is easy to use.
Vera van Lin - Business Intelligence program manager.
The road to new insights
To take the first steps toward data-driven work, a number of challenges were addressed. These included:
- Inefficient and time-consuming data processing and analysis
- Limited visibility and access to data for employees
- Difficulty integrating and managing data from multiple sources
After an extensive inventory and proof of concept, the best-fit solution for Cordaan turned out to be a self-service cloud data platform consisting of Fivetran (data integration), Snowflake (data cloud platform), DBT (data modeling) and Tableau (data visualization). The Information Lab worked closely with Cordaan's IT and business teams to understand their specific requirements and tailor the solution accordingly.
By choosing low-code / no-code and thus easy-to-use tooling for everyone, it makes taking the organization along to gain new insights a lot easier. By enthusing, informing and training the different types of users within the organization, the adoption of using data is stimulated. More attention will be paid to this in the coming period.
With the new self-service cloud data platform, which we established and set up together with The Information Lab, all information is offered to the organization in one central place, securely and easily.
Vera van Lin - Business Intelligence program manager.
Better decision-making through data analysis
With the new self-service cloud data platform, which we created together with The Information Lab, all information is offered to the organization in one central place, securely and easily. Naturally, it is arranged that users only get to see the data that is allowed and relevant to them. With the support of the Cordaan BI team, the organization is further assisted in the search for new insights.
The platform will go on to provide improved efficiency in data processing and analysis, giving employees more time to focus on their primary tasks. In addition, the platform will provide improved visibility and access to data for employees, resulting in accurate reporting and decision-making based on reliable data.
What's next?
Analyzing data and thereby gaining insights that impact daily operations is of great importance to Cordaan. It allows her to make decisions and steer where necessary. In the longer term, tactical and strategic insights will also come into play. Previously unused (external) data will then be used to answer questions regarding, for example, labor efficiency, housing and staff development.
About Cordaan
As one of the largest healthcare organizations in Amsterdam, Cordaan wants to take responsibility for the development of long-term care in the city. Cordaan provides care to more than 20,000 people from 120 locations in Amsterdam, Diemen, Huizen and Nieuw-Vennep. It does so with almost 6,000 employees and over 2,500 volunteers. But also in cooperation with informal caregivers and other care professionals, research institutions and many social organizations.
Cordaan helps anyone, young or old, who needs nursing, care, guidance and/or support for a short or long period of time. If someone needs care and nursing, has a mental disability or is struggling with chronic psychological problems. We strive to enable everyone to remain independent for as long as possible. Preferably at home, in their own environment. And if that is not possible, in an environment where they feel safe.
About The Information Lab
The Information Lab is a leading data and analytics consulting firm that helps you adopt and harness the power of technology. We help you streamline processes to collect and analyze data so you gain valuable insights to make informed decisions and achieve better results. We embrace innovation, adopt the latest technologies and implement the most successful data and analytics solutions. We do this for organizations within healthcare, finance, transportation and logistics and other industries. Our experts have knowledge and experience in data strategy, governance, engineering, visualization, agile and low-code solutions. In addition to high-quality consulting and implementation of data platforms, The Information Lab offers training that helps you work better, smarter and faster.
The simplicity of using the tooling and unlocking and processing the data correctly is of course important. But more important is informing and training the different types of users within our organization. The Information Lab has helped us with this and will remain involved in enthusing the users in the coming period.
Vera van Lin - Business Intelligence program manager.

Fietsenwinkel.nl
International Bike Group (IBG), the international bicycle retailer, known in the Netherlands for Fietsenwinkel.nl, has selected Tableau to better see and understand their data. IBG aims to become more data-driven and collects data from its on- and offline channels in several countries. Tableau's solutions allow IBG employees to visualize and analyze data without external support.
Under the names Fietsenwinkel.nl in the Benelux and HelloRider in Scandinavia, IBG offers fully integrated online and offline sales combined with an extensive after-sales service network. With an annual growth rate of over 70%, the company is reinventing the conservative bicycle market and can count itself among the fastest growing e-commerce companies in Europe. After achieving the initial benefits of a data-driven corporate culture, the company was eager to take it to the next level. To do this, it became essential that in addition to the company data analysts, other employees could tap into their own data for insights.
While rebuilding the data warehouse under the existing data platform on the Google Cloud Platform, IBG began a thorough selection process to find a solution that both analysts and other business users could use. In particular, the solution needed to be easy to use and feature high-level visualizations to optimize decisions and improve business operations. The fact that with Tableau, IBG staff would be able to create and work with dashboards without the help of outside experts, allowing business users to search for answers independently, decided in Tableau's favor.
In the first implementation, 80 IBG employees and 40 stores will start working with Tableau, from different departments such as marketing, sales, logistics and strategy. Through Tableau, they will be able to gain new insights, make analyses and collaborate more easily and effectively. More data and correlations can be included in the interactive dashboards ("Vizzes"), and everyone can be confident that colleagues are looking at the same data. Tableau Gold partner The Information Lab will help IBG set up the infrastructure and train the team and provide further support.
Gijs Louter, Head of Business Intelligence & Pricing at IBG: "International Bike Group has set ambitious goals for the future and our data plays a key role in that road to success. We chose Tableau based on their excellent and intuitive capabilities for self-service, visualization and collaboration. By generating more insights from inventory, customer service or store performance, we are making IBG a little smarter every day, supporting our goal of becoming the best omnichannel bike store in Europe. "
IBG, founded in 2009, has more than 500 employees in Benelux and Scandinavia and is headquartered in Amsterdam. In addition to their online channels, customers can visit more than 50 experience stores and more than 250 service partners.
Diederick Beels, sales director Benelux at Tableau concludes, "International Bike Group's scale and successful omnichannel approach make it an impressive market player. Their data-driven approach is inspiring and we look forward, together with The Information Lab, to helping them democratize visual analytics across the company to support their business goals."
About IBG
Under the names Fietsenwinkel.nl in the Benelux and HelloRider in Scandinavia, IBG offers fully integrated online and offline sales combined with an extensive after-sales service network. With an annual growth rate of over 70%, the company is reinventing the conservative bicycle market and can count itself among the fastest growing e-commerce companies in Europe.
About The Information Lab
The Information Lab is a Gold Partner of Tableau and supports organizations with its implementation and adoption. In addition to training and support, we help to work optimally data driven.
About Tableau Software
With Tableau (NYSE: DATA), people can see and understand data better. Tableau helps to easily analyze, visualize and share information. More than 82,000 users are quickly getting results with Tableau in the office and on the go. Hundreds of thousands of people have used Tableau Public to share data in blogs and on websites. Download the free trial of Tableau and experience how it works for yourself: www.tableau.com/trial.
Fietswinkel.nl
- Category: Customer case
- Customer: fietswinkel.nl
- Interviewee: Gijs Louter
- Role: Head of Business Intelligence & Pricing
- Service: Tableau

Peter Appel Transport
Peter Appel Transport provides transportation services in the Netherlands and innovates new ways to transport temperature-controlled materials. Before Tableau, Business Analyst Gert-Jan Neeft worked with data in Microsoft Excel and Access. The process was time-consuming and the end results were not pleasant for Peter Appel Transport's business analysts and customers. With Tableau, data is now fun and easy - so easy that Gert-Jan was able to create his first business report on his second day. In this video, Gert-Jan discusses how data analysis has now become faster, more efficient and more fun thanks to self-service analytics.
Tableau: What has been the most fun about using Tableau so far?
Gert-Jan Neeft, Business Analyst: If you have a question you ask it and the nice thing is that it's used in all time zones, so when I'm in bed the answer, so to speak, is already written. And the next morning I can continue with my question or the challenge I have. And that's just fantastic.
Tableau: What led you to Tableau?
Gert-Jan: Our attention was actually caught by our accountant on QlickView. We had a demo of it, but I personally found it rather complicated and not very intuitive to be able to do anything with one or two data sets. I then went to the best-known search engine, Google, and quickly came across Tableau. I had never heard of it before, but I could download it for free for 14 days. I did that very quickly and basically got started without anything - without training, without people I knew. I just played with it at night.
Tableau: Did you find Tableau user-friendly?
Gert-Jan: Without ever having seen or used the tool, I had actually made my first report on the second evening. That got me very excited. I thought, yes, this is it. And then we really stopped the whole selection process. I went to my director, Peter Appel and told him we needed this. And I need a license and we need to get going. And that's like our philosophy: just do it! And he said, yes, you are a specialist in this field and if you say we need this then we need this and we will do it.
Without ever having seen or used the instrument, I had actually made my first report on the second night. That got me very excited. I thought, yes, this is it.
Tableau: How has Tableau changed your job?
Gert-Jan: I was working a lot with data and doing it with Excel, Access, with all kinds of tools. And with Tableau it just became more fun and it's much faster, it's much easier, you can do much more with it, you can share much easier with people, give access, authorize. The whole concept is really what I would like to have as a BI specialist within Peter Appel transportation, yes it's in the package. I get data sets from customers, you read them in, and you can get started. I can just get to work myself. That makes life a lot easier and more enjoyable. I don't have to wait for other people anymore. I don't have to ask other people any more, because I can just do it myself. And with the dashboards I created, I can very quickly give access to the right people within the organization. They can work with the data. Sometimes they come back with questions, like: "I would also like this, I would also like that." We sit down with them for half an hour and it's drag and drop, "sleur and pleur" in Dutch, and that makes me happy.
Tableau: Have you found the Tableau community to be helpful?
Gert-Jan: The community is so big, so you learn every day very easily and very quickly. And because of that, your dashboards only get better, even more beautiful, even faster. I actually say: it really is a kind of drug. It really is like an addiction. You just want it and you just want more. You just want to go faster. You want to get everything out of the tool that you can. And I'm kind of in that phase right now. I follow a lot of blogs and YouTube channels. I'm reading, watching, saving and getting started with everything I can find about Tableau.
Tableau: How has Tableau helped you achieve your data goals?
Gert-Jan: If I look at myself, I was very busy preparing a report and it really provided one insight and that was it. And sometimes a week of data came along and you refreshed it and that was it. But you want to go further, you really want to give it to the user so that they can interact with that data very interactively. And actually expand their understanding further. That's actually what I've been able to achieve with Tableau.
Peter Appel Transport
- Category: Customer case
- Client: Peter Appel Transport
- Interviewee: Gert-Jan Neeft
- Role: Business Analyst
- Service: Tableau
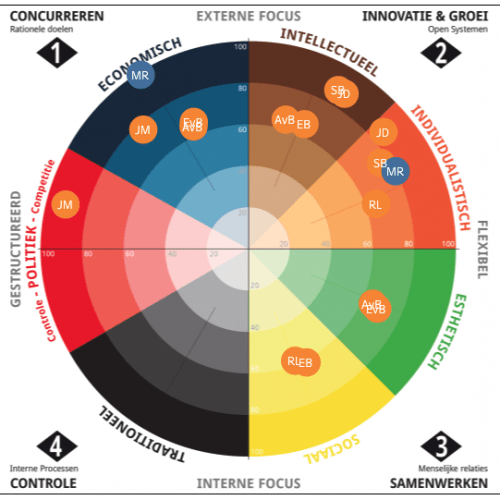
Mastermind
What is your role and what does your organization do?
I am a partner at Mastermind and under the brand name DISCOVER, we offer solutions for the growth of people, teams & organizations. We use online personal analysis for behavior, drives and talents. Through DISCOVER Partners and DISCOVER Professionals you as an individual or as an organization get access to these solutions to further develop yourself as a person, as a team or as an organization.
What do you guys use Tableau for?
We use Tableau in conjunction with our product DISCOVER for personal analysis. We import individual scores into Tableau. In interactive team and organizational overviews, we provide insight into team dynamics and development potential. Think of topics such as motivation, problem approach, communication styles and leadership analysis. To give you a good idea of this we have an example on Tableau Public.
Why did you choose Tableau?
We looked at Tableau, Qlik and PowerBI in extensive research. From that, it became clear very quickly that Tableau was the only tool that could offer what we needed within the standard functionality and licensing costs. For us, advanced graphical views and interaction were especially important. Qlik could not offer that at all and PowerBI only as a custom tool at high cost and with little flexibility.
What results have you achieved with this?
We have added something to our product offering with Tableau online dashboards that adds real value for our customers and also makes us unique from our competitors. We see this reflected in more customers and higher sales with existing customers.
What has The Information Lab contributed to this?
From day 1, The Information Lab has helped us learn how to work with Tableau and always supports us when we need it on both new applications and troubleshooting. They do this well and quickly.
Castor
- Category: Customer case
- Client: Mastermind
- Interviewee: Marco Robben
- Role: Partner
- Service: Tableau

Sparkles
Sparkles is a company that makes design accessible to everyone through the use of user-friendly online software. A personal invitation, a business card, a sophisticated local marketing campaign: with our platforms, businesses and consumers easily create personalized products that impress their target audiences.
Matthijs Schalk, marketing & innovation officer at Sparkles, talks about how Tableau and Alteryx are used and how he experiences working with The Information Lab.
What is your role and what does your organization do?
Through our webshops, thousands of people personalize and order cards and matching products for the most important moments in life: birth cards, wedding cards, greeting cards, invitations and bereavement cards. In addition to the Netherlands and Belgium, we are active in Germany and have ambitious plans for further expansion to more products and countries. Some of our shops are madeformoments.nl, prettyorange.be and prettyorange.de
As marketing & innovation officer, I help think of new strategies and tactics to make our customers even happier and Sparkles continue to grow. Together with the teams, we implement new ideas every time and go for delivering ultimate value to our customers. We continuously conduct experiments to discover what works and what doesn't.
What do you guys use Tableau / Alteryx for?
We use Tableau for our daily performance. A number of colleagues literally get up with it and go to bed with it. Then we have the analytics, where teams analyze specific segments, product groups or other things.
Alteryx has helped us make Tableau reports much faster. The preparations are only a fraction of the size and complexity that we previously had entirely in Tableau. We've also gotten a much better handle on things where previously we were steering primarily by feel. For example, we now use a customer journey dashboard, where data from a customer journey is aggregated from multiple sources and tables.
Why did you choose Tableau / Alteryx?
Tableau is very versatile and relatively easy to learn. Its visualizations provide stakeholders with quick and clear insight. And in my opinion, Tableau is still the crème de la crème for data visualization, with an accessible licensing model.
Alteryx connects well to our infrastructure and provides enormous possibilities and flexibility for data preparation. Compared to in-house code, Alteryx offers great advantages, including the merging of data from different sources and, of course, the fact that far fewer developers are needed.
What results have you achieved with this?
Within seconds we can see how the business is doing. That and the depth with which we can manage data-driven makes it possible for us to grow again and again in competitive markets.
What has TIL contributed to this?
The Information Lab helped us get started with Tableau in the first place and later with Alteryx. The support and advice from TIL is very pleasant, knowledgeable and very warm. The idea that you can just call or email and get an adequate response makes The Information Lab a reliable partner.
Want to read more about how our customers are successful with Tableau, Alteryx, Snowflake and how we help them do it? Read more customer success stories here.
Sparkles
- Category: Customer case
- Client: Sparkles
- Interviewee: Matthijs Schalk
- Role: marketing & innovation
- Service: Tableau & Alteryx

bol.com
Bol.com is one of Europe's largest online retailers, offering a huge range of products to millions of Dutch and Belgian customers through its virtual marketplace.
Here, Anne van den Brink, Business Intelligence Manager for bol.com, discusses the importance of fast, agile data analytics in online retailing and how Tableau has helped Bol.com transform into a data-driven organization, where employees can fill many of their own data needs themselves.
Anne, what do you think is the secret to success in today's online retail industry?
Flexibility plays a big role. The ability to respond quickly to changing consumer habits has always been critical in retail, but this is especially true in online, where shoppers will quickly go elsewhere if we don't have exactly what they want, when they want it.
How does Tableau help bol.com stay agile?
Agility is easy when you're small, but it becomes increasingly difficult as you grow unless you have the right tools. That's why Tableau has become so essential to our business. The fast, accurate data insights it provides into key areas - such as buying habits and seasonal trends - allow us to quickly adjust our marketplace and product offerings so that every customer can easily find what they need.
Tableau has also given us greater control over our operations, such as inventory management, assortment quality and inventory levels. This has allowed us to improve overall customer service while reducing our impact on the environment.
Why did bol.com choose Tableau over other analytics platforms?
One of Tableau's key selling points for us is its extensive functionality, as illustrated by the examples above. Tableau's highly visual approach to analytics means that people can view multiple insights on a single dashboard, making it easy to see key outliers and trends.
Scalability was also an important factor. Over the past five years, our business has grown exponentially, meaning that the number of data sources has grown to more than 250 and the number of active Tableau users has increased from 200 to more than 750. For many analytics platforms, these factors would cause major problems, but with Tableau we can continue to add new data sources and users without any impact on overall performance.
Finally, ease of use was essential. Once employees see and use Tableau for themselves, they quickly realize how easy it is to meet their own analytics and reporting needs rather than relying on the central BI team. Not only has this made analytics more accessible to everyone, but it has also helped bol.com become a data-driven organization, where insights from data are used to support decision-making at every level.
What role has The Information Lab, a technology partner of Tableau, played in your success with Tableau?
The support from The Information Lab was invaluable, especially during the initial rollout phase. Their knowledge and expertise helped the BI team quickly get up to speed with Tableau, giving us the momentum we needed for a successful implementation. Today, our team has reached a higher level of maturity and expertise, but we still appreciate the ongoing support and knowledge from The Information Lab.
Update (June 2020): How did being a data-driven company help you effectively navigate the COVID-19 pandemic?
When you are a data-driven company, you always know where your main focus and responsibilities lie. This makes it easy to operate effectively even as the world around you changes completely. Before the COVID-19 pandemic, I worked with 2,000 colleagues in the same office, but almost overnight everyone had to work from home. That could have caused a major upheaval, but because all of our teams are focused on clear, data-driven goals and objectives, they can continue to function autonomously despite everything going on around them.
Since the lockdown began in the Netherlands on March 12, the number of employees using Tableau daily has increased 15 percent across the company. It illustrates how intrinsic data has become in our daily activities, especially at this unprecedented time. Of course, traditional in-person training is not possible at this time, but in just four weeks we developed a comprehensive online course, turning all the classic Tableau training modules into e-learning sessions. This allows employees to progress with their data skills at their own pace, whether they are experienced with the platform or completely new to it. This allows us to expand the base of our data skills within bol.com as a whole, which puts us in a strong position for the future.
Bol.com
- Category: Customer case
- Client: bol.com
- Interviewee: Anne van den Brink
- Role: business intelligence manager
- Service: Tableau
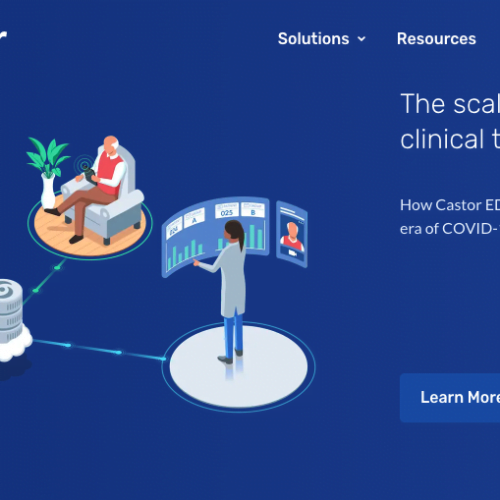
Castor
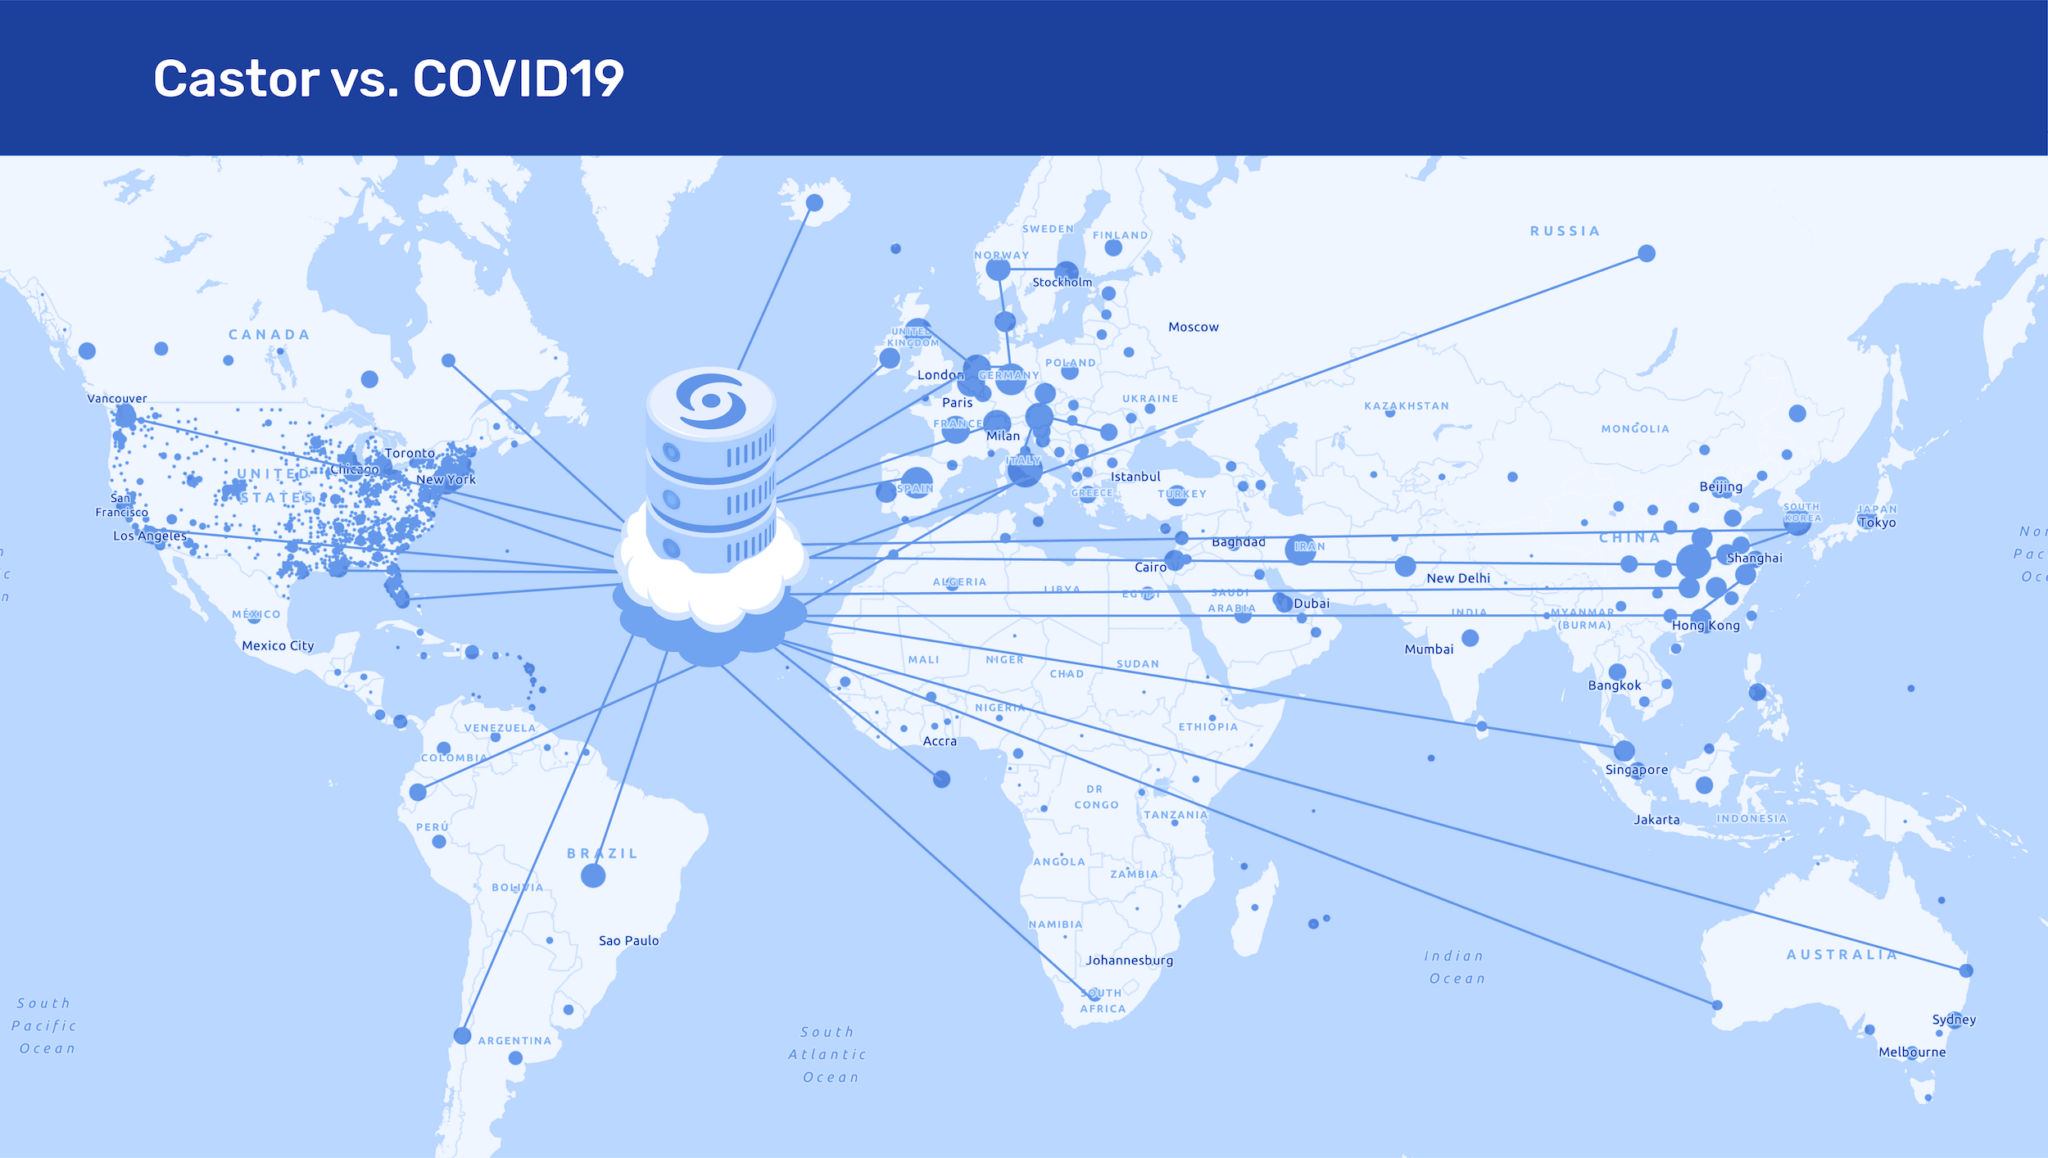
Castor supports Covid-19 clinical research around the world with Tableau
Castor is passionate about transforming medical research. Thousands of medical device, biotech and academic institution researchers around the world rely on the Castor EDC (Electronic Data Capture) platform to easily integrate high-quality data from any source and accelerate their studies.
Here, Castor's CEO and founder Derk Arts discusses how visual analytics with Tableau - as part of the Castor EDC platform - is being used to better understand the Covid-19 virus, optimize valuable hospital resources and ultimately improve Covid-19 patient outcomes.
Tableau was the first choice to support our Covid-19 program. It is easy to use and incredibly powerful, and allows people to understand research findings significantly faster and more efficiently.
- DERK ARTS, CEO
How does Castor's technology support the fight against Covid-19?
Before I launched Castor, it was clear to me that medical research and evidence-based medicine were not making optimal use of data. Decisions were still too often made based on paper documents, spreadsheets or free text publications. I wanted to do something about that. At Castor, we envision a future where all medical research data is machine-readable, reusable and available to everyone to improve patient outcomes.
When new virus strains like coronavirus emerge, data are clearly our most valuable asset. This was true during the Ebola outbreak, where we had decades of research on the effects and possible treatments, and it is doubly true in the case of coronavirus.
Castor's research EDC platform is available free of charge to all Covid-19 research projects. We now support more than 200 Covid-19 studies in 16 countries. And because time is of the essence, we ensured that these studies could go live within an average of six days. We developed pre-built electronic case report forms (eCRFs) based on World Health Organization (WHO) standards, to help researchers get their study or registry up and running in less than an hour.
How does Tableau fit into this Covid-19 study?
One of the best ways to maximize the impact of data is through visual analytics. And no one does that better than Tableau. Tableau was the first choice to support our Covid-19 program. Easy to use and incredibly powerful, it enables people to understand research findings significantly faster and more efficiently.
We ensure the optimal allocation of limited hospital resources and ensure that the most seriously ill patients receive the highest level of care.
- DERK ARTS, CEO
Can you give an example of Covid-19 research and how Tableau is used?
Castor has provided its EDC platform free of charge for any nonprofit research related to Covid-19. And Tableau is an integral part of that. This is especially true in the case of the Covid Predict study, a collaboration between physicians and researchers in the Netherlands to better understand and predict which Covid-19 patients should receive which treatment and type of care. We ensure optimal allocation of limited hospital resources and ensure that the most seriously ill patients receive the highest level of care.
Our EDC system helps the Covid Predict consortium easily capture data from multiple sources - it currently includes more than five million data points. Algorithms for predicting disease outcomes are created and tested with data retrieved in real-time via Castor's API, which enables integration with a wide range of other platforms. These algorithms help predict the likelihood that a patient will require intensive care, and if so, what the likely outcome will be.
Tableau enables people to understand all this quickly and easily. It provides an overview of admissions to the Intensive Care Unit (ICU), medium care unit and hospital wards, and visualizes patient outcomes and complications. For example, one crucial dashboard shows the demographic age profile of admissions, the average length of admission, and the number of people discharged from the hospital, admitted to the hospital, transferred, receiving palliative care, or sadly deceased.
This is remarkable and valuable work.
What role did Tableau partner The Information Lab Netherlands play in supporting these projects?
All of this was made possible through trusted collaboration with Tableau, The Information Lab's expertise, and Alteryx. Thus, in just a few days, The Information Lab created these incredibly powerful visualizations, which ultimately help reduce hospital crowding, protect staff and prioritize patients who need to be admitted to the hospital.
How important is it for healthcare providers to become more data-driven?
Everyone must come together with a shared mission to see data as a reliable commodity. Once data can circulate freely among researchers, clinicians and others, for example, it becomes possible to shorten research cycles and improve health care outcomes.
Castor
- Category: Customer case
- Client: Castor
- Interviewee: Derk Arts
- Role: CEO
- Service: Tableau