

Since 13 March 2020, many people have been working from home. This provides new opportunities and challenges. Our team has also been working from home for 11 weeks. Sales, marketing, customer success and...

Last week, during the last webinar in the data culture series, we talked about the importance of analytical knowledge and a community. To be successful as an organisation...

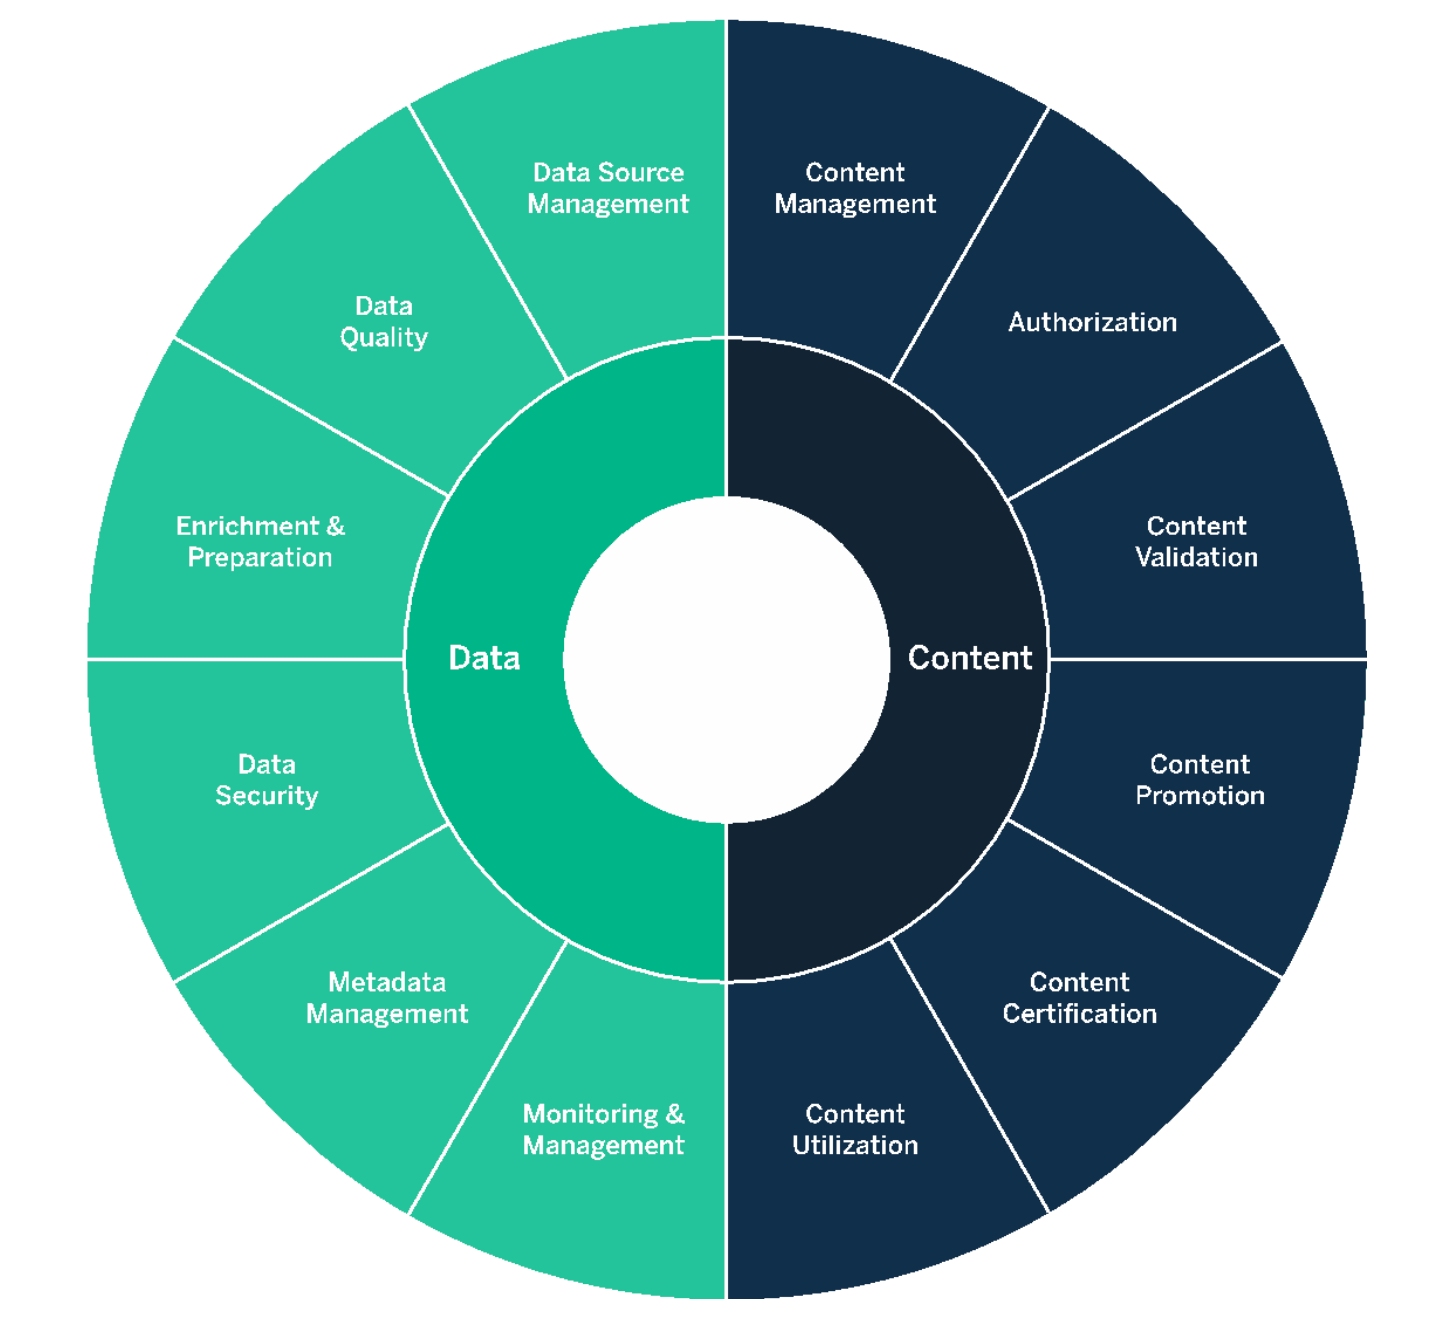
In order to be able to work in a data-driven way, it is important to consider the type of guidelines and processes to put in place. Although no two organisations are the same, the...
We regularly receive questions about how to monitor your default house style in a self-service BI environment. If you have hundreds of dashboards on your Tableau server, how can you...
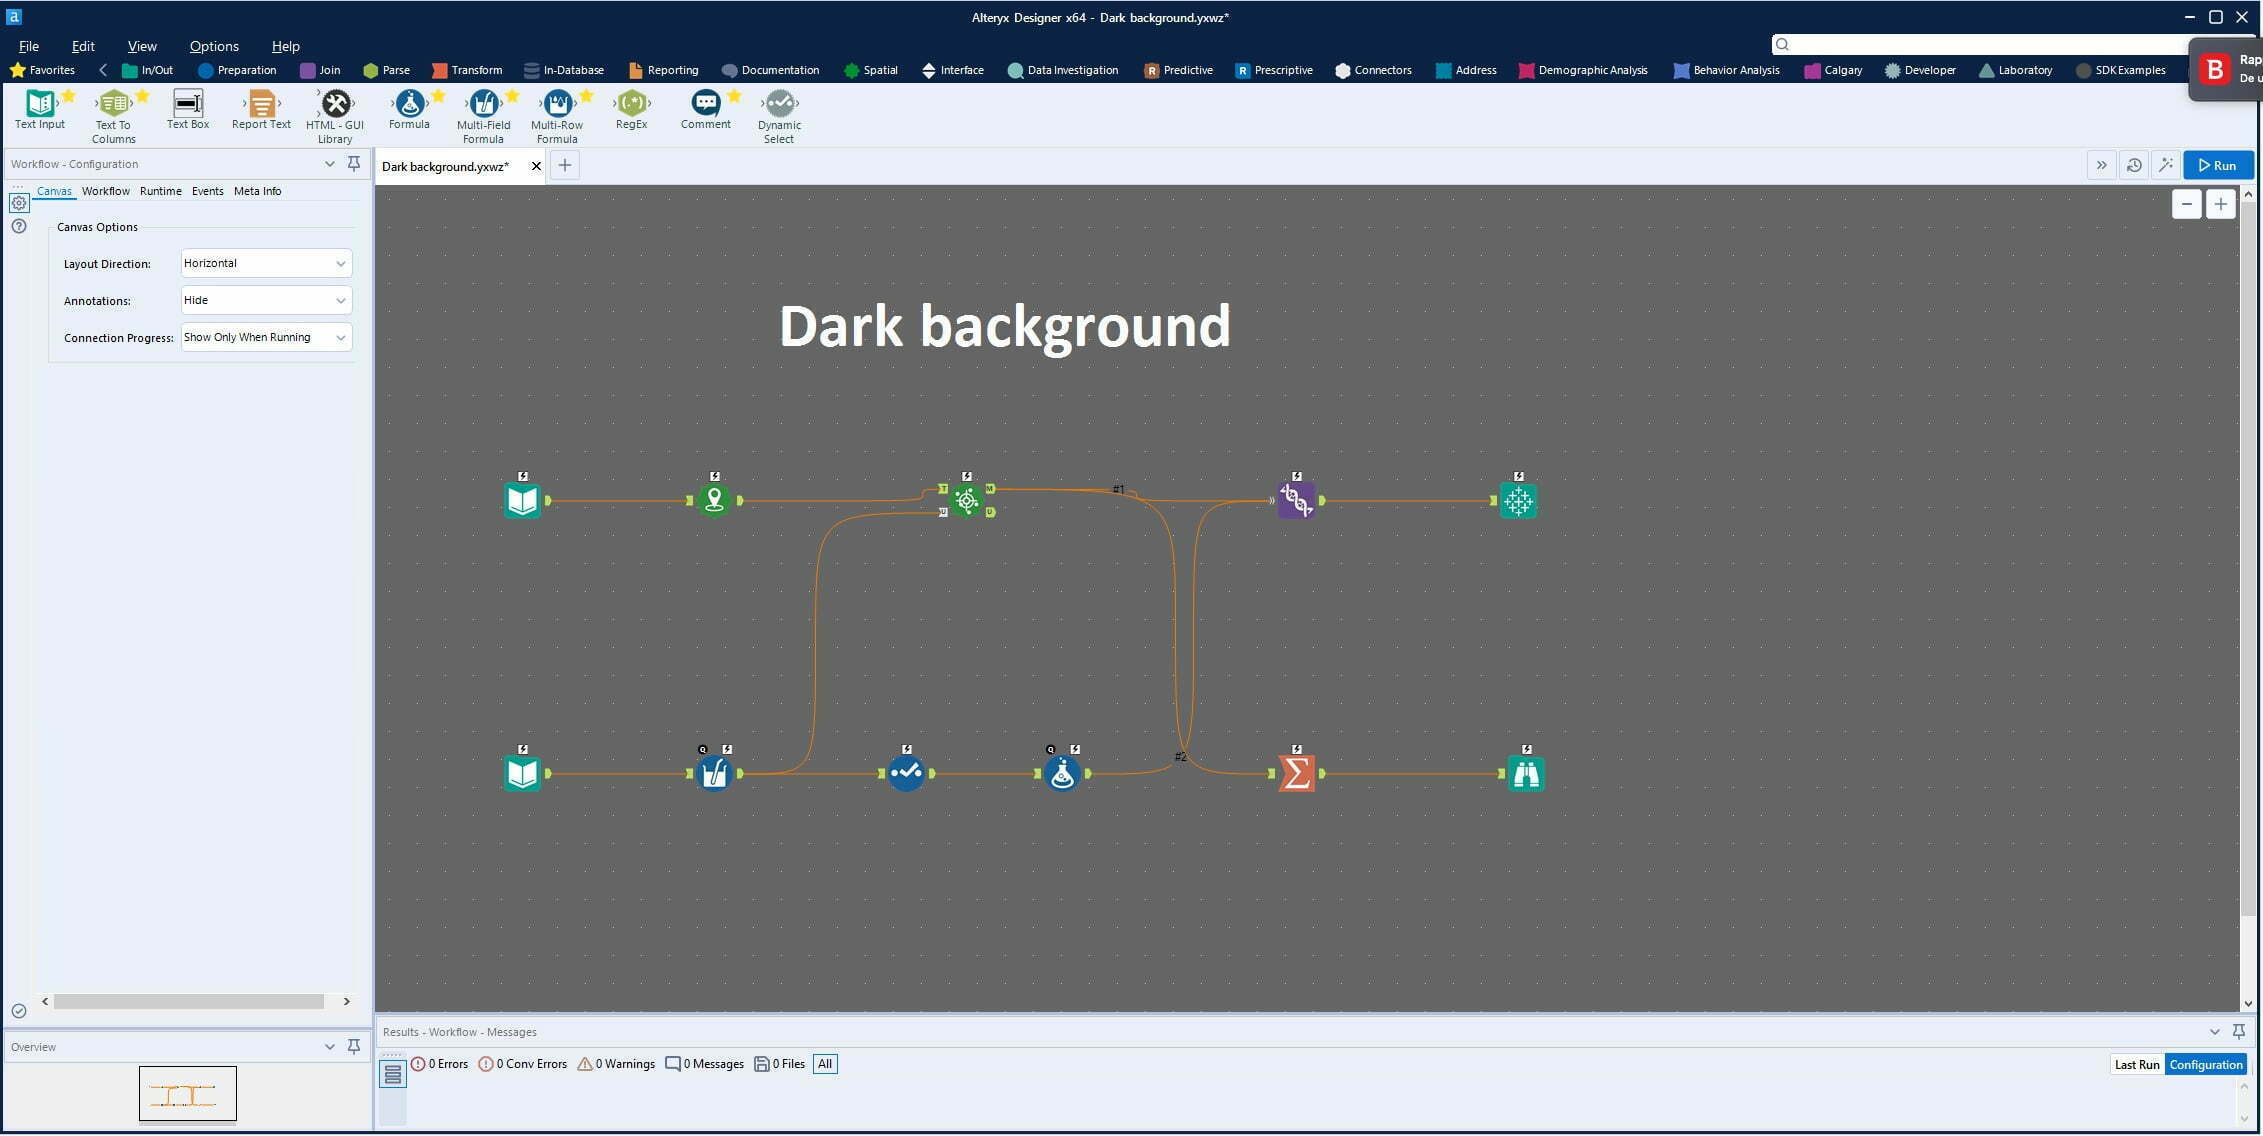
In my opinion, a dark background with light letters makes a text easier to read than the other way round. That's why I like to work with dark mode, both on my computer and...
One of the best ways to communicate your results/data is through pictures. In the world of football, one method you could use to do this, is to plot your...

Data collection, linking and preparation are not new terms for organisations these days. We have probably all started to visualise this collected data without actually doing it.
From 14 to 17 October, I attended Alteryx's Inspire Europe 2019 event in Tobacco Dock, London. Although it was only my first Inspire,...

With the results window, you can quickly and easily view the data in your workflow in Alteryx Designer. Since version 2019.2, the results window in Alteryx Designer is more interactive...