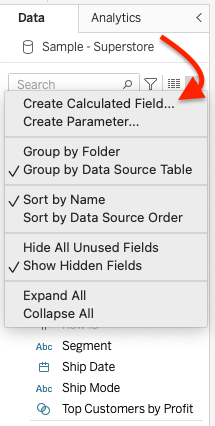
- Right-click on the field 'Profit Ratio'
- Choose the option 'Edit'...
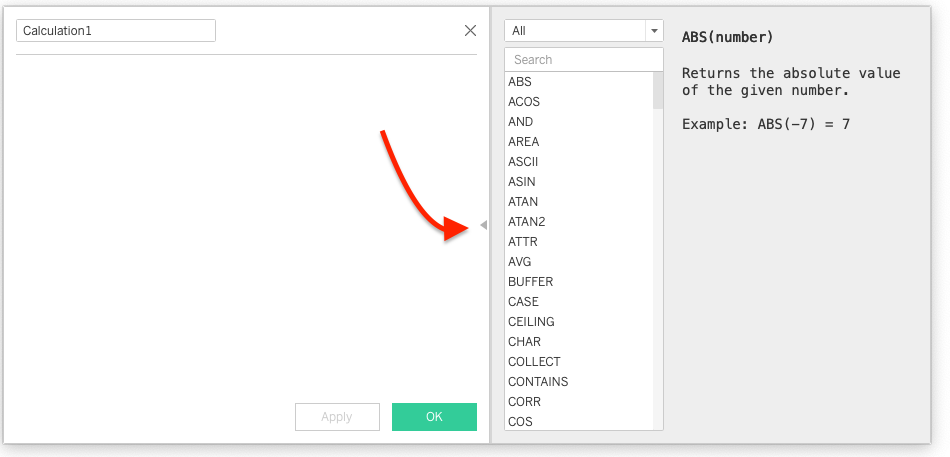
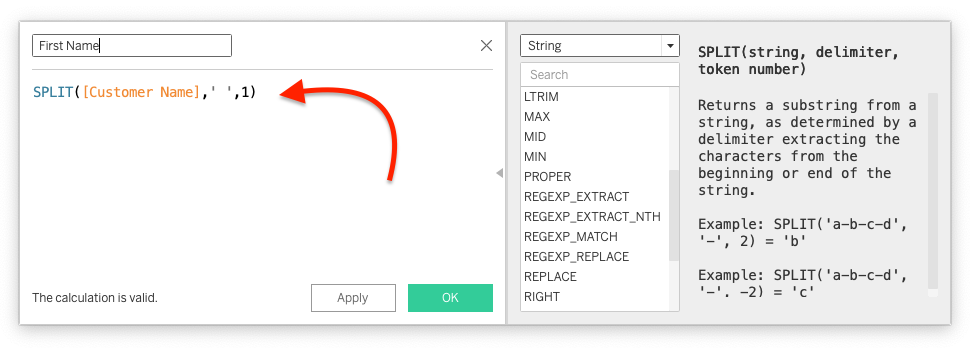
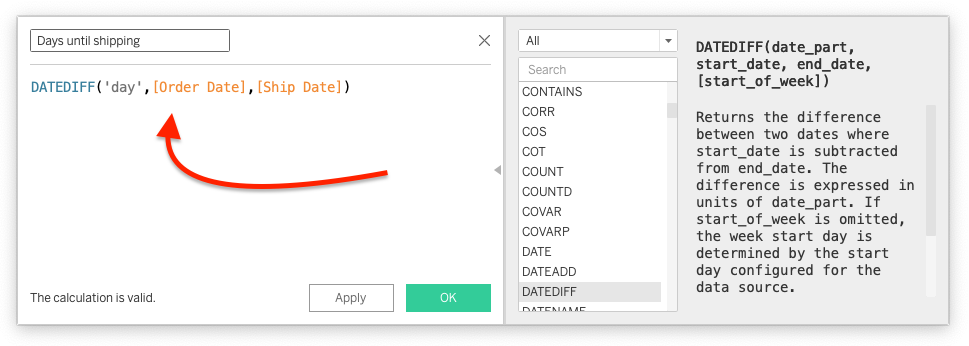
- The Calculated Field now opens. Here you see the calculation with the Functions used.

Functions are given a blue color. Columns/fields used in the calculation have an orange color. This way you can easily distinguish them. Furthermore, we see the function SUM. The SUM-function adds up all the values of the field named inside the parentheses. We use that function here first for the fields themselves, because we need the total gain by the total sales sales. If the only profit/sales as a formula, Tableau calculates for each row in the data set (i.e., for each individual sale) the profit ratio, and then adds all these margins together. As a result, we get an incorrect result. So it is important that we use SUM. So we divide the SUM of profit by the SUM of sales.
Tip: with two '//' characters, we can enter a comment in the calculated field. Useful if colleagues later want to view or modify the explanation of a calculation.
4. Type a comment by starting with //. The text turns gray, so you know that the comment has no further influence on the calculation.
 On a new sheet you can add the following columns use for a visualization: Days until shipping on the columns shelf, and Order ID on the rows shelf. The resulting bar chart shows for each order how many days it took from order to shipment.
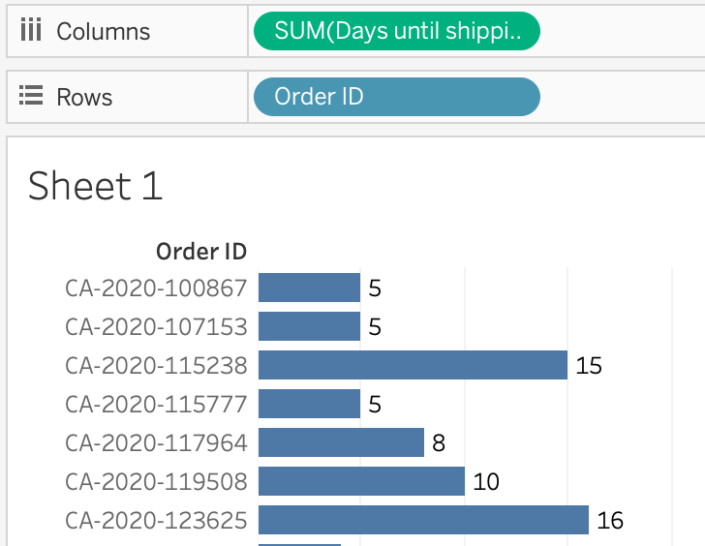
...At least, if we assume that each Order ID contains only one line.
Since Tableau automatically aggregates with SUM, we cannot tell if this is the sum of 1, 5 or 100 lines. So it is always important to keep an eye on what Tableau is doing and what possible consequences it might have. There are several ways to test the outcome of our calculation.
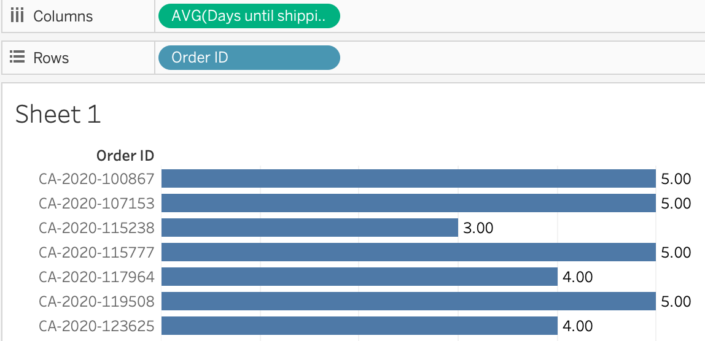
- Right-click on Days Until Shipping and choose Measure > Average. With that, Tableau divides the sum of the number of days per Order ID by the number of lines that make up that sum.
 or
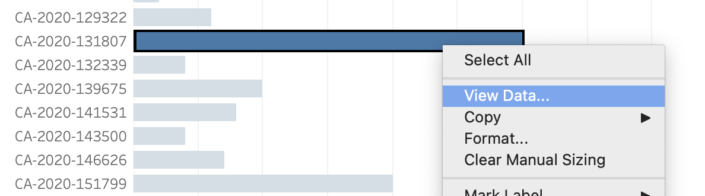
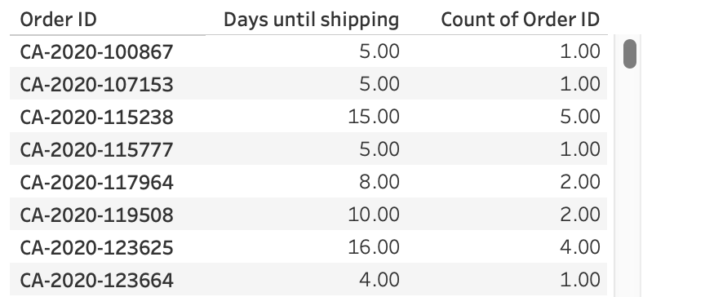
or - Make sure Days Until Shipping as sum is aggregated. Right-click on one of bars in your screen of a Order ID with a very long delivery time. Click on View Data.... A pop up window will now open. If you now click on the name of the source table here, you will see the how in the visualization present fields in the table. In this case, the order probably contains 6 products, so there are 6 lines.


or - Drag from the Data Pane again the field Order ID To the Columns Shelf in addition to Days Until Shipping. Right click on Order ID in the Columns Shelf and select Measure > Count. Now you see that the field Order ID turns green. At the top right of your screen, click on Show Me and select the table, at the far top left. We can now see that the Order IDs with high values for Days Until Shipping in many cases also occur more frequently in the dataset. Coincidence? You name it, you're the analyst!

 or
or