
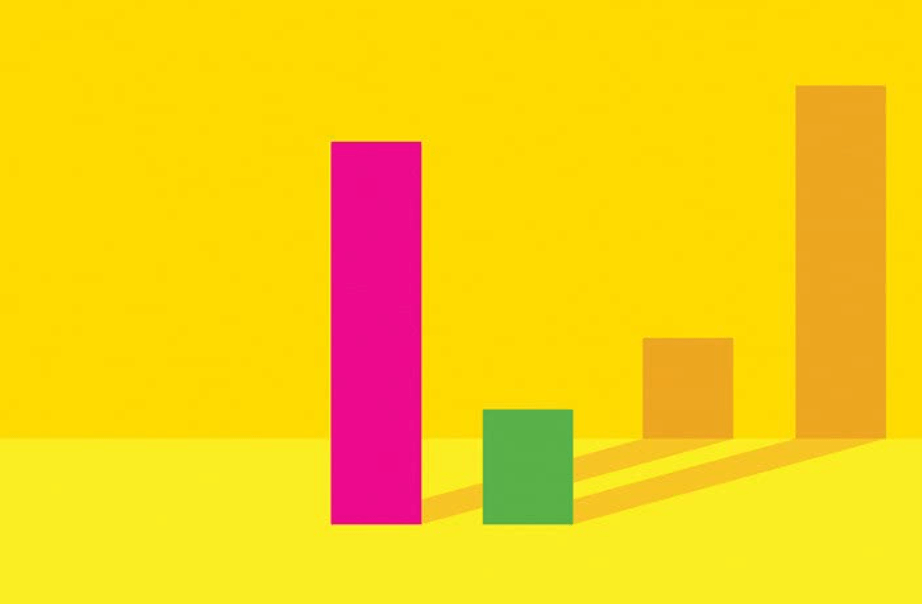
Visualizing data is a powerful way to convey information. But with the same power, consciously or unconsciously, you can also present false information convincingly. These are...
Our sensory memory helps us recognize important information in the world around us at lightning speed. It does this by scanning for pre-attentive features. In a mini-series of...

Our sensory memory helps us recognize important information in the world around us at lightning speed. We do this by scanning for pre-attentive features. In a mini-series of...

Last month was the Tableau Conference 2022 in Las Vegas. For the first time since 2019 as an in person event! Now that everyone has recovered a bit from the jet lag,...

The dataset we will examine, taken from A century of weather in The Netherlands on Kaggle, covers 120 years of observations made in De Bilt, the KNMI base office,...
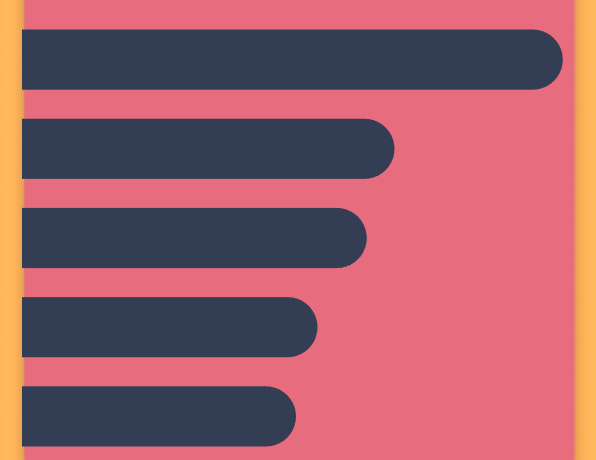
Rounded bars in Tableau is a subject my colleague Gaia Pometto explained one of her recent blogs where she showed to create rounded bars in Tableau as part of...
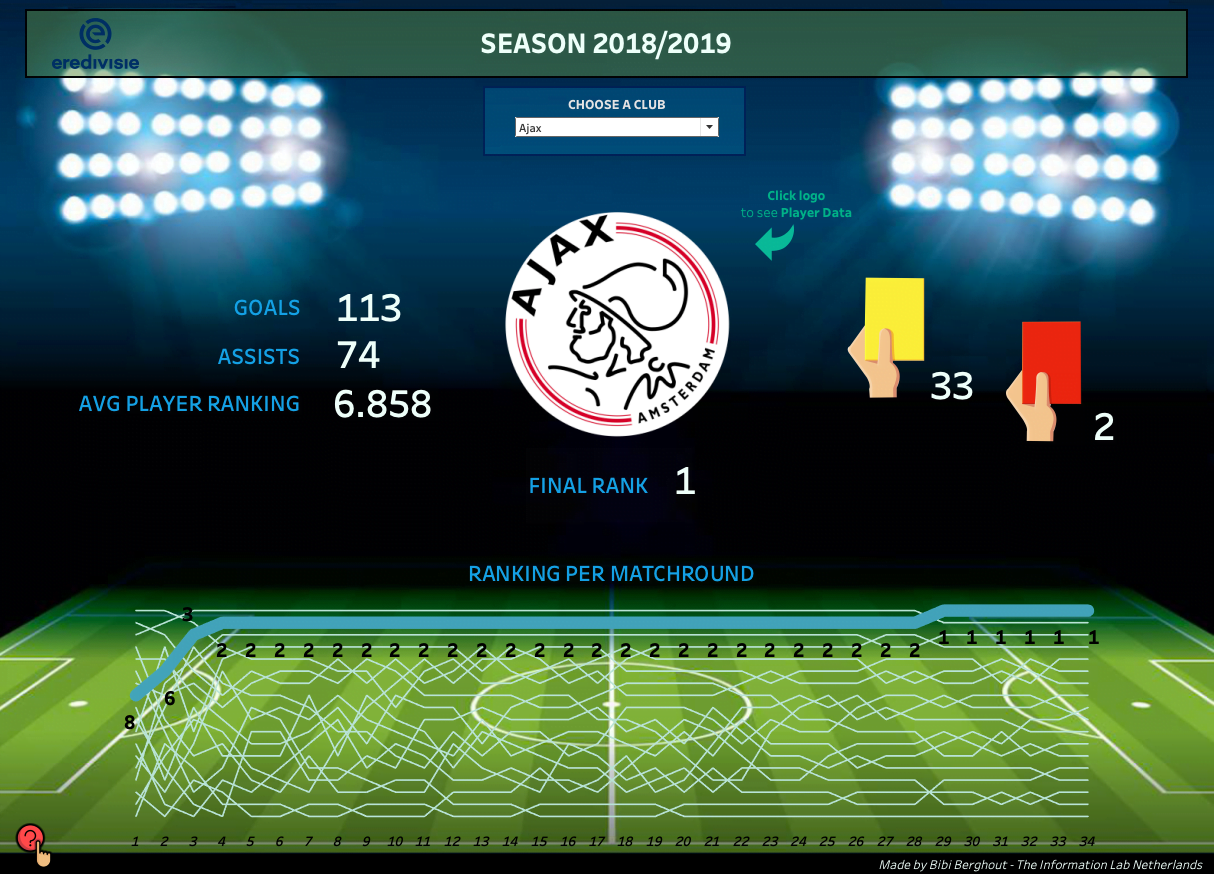
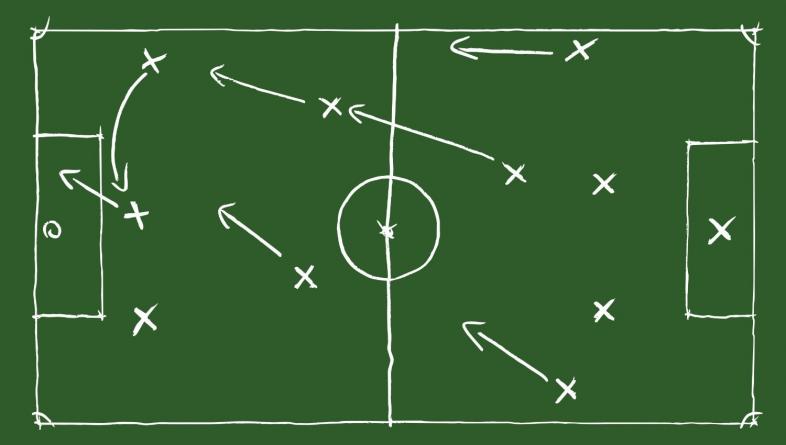
For a dashboard about the Eredivisie, the Dutch football league, I used a parameter to control the views. In an earlier blog I describe how I used the parameter...
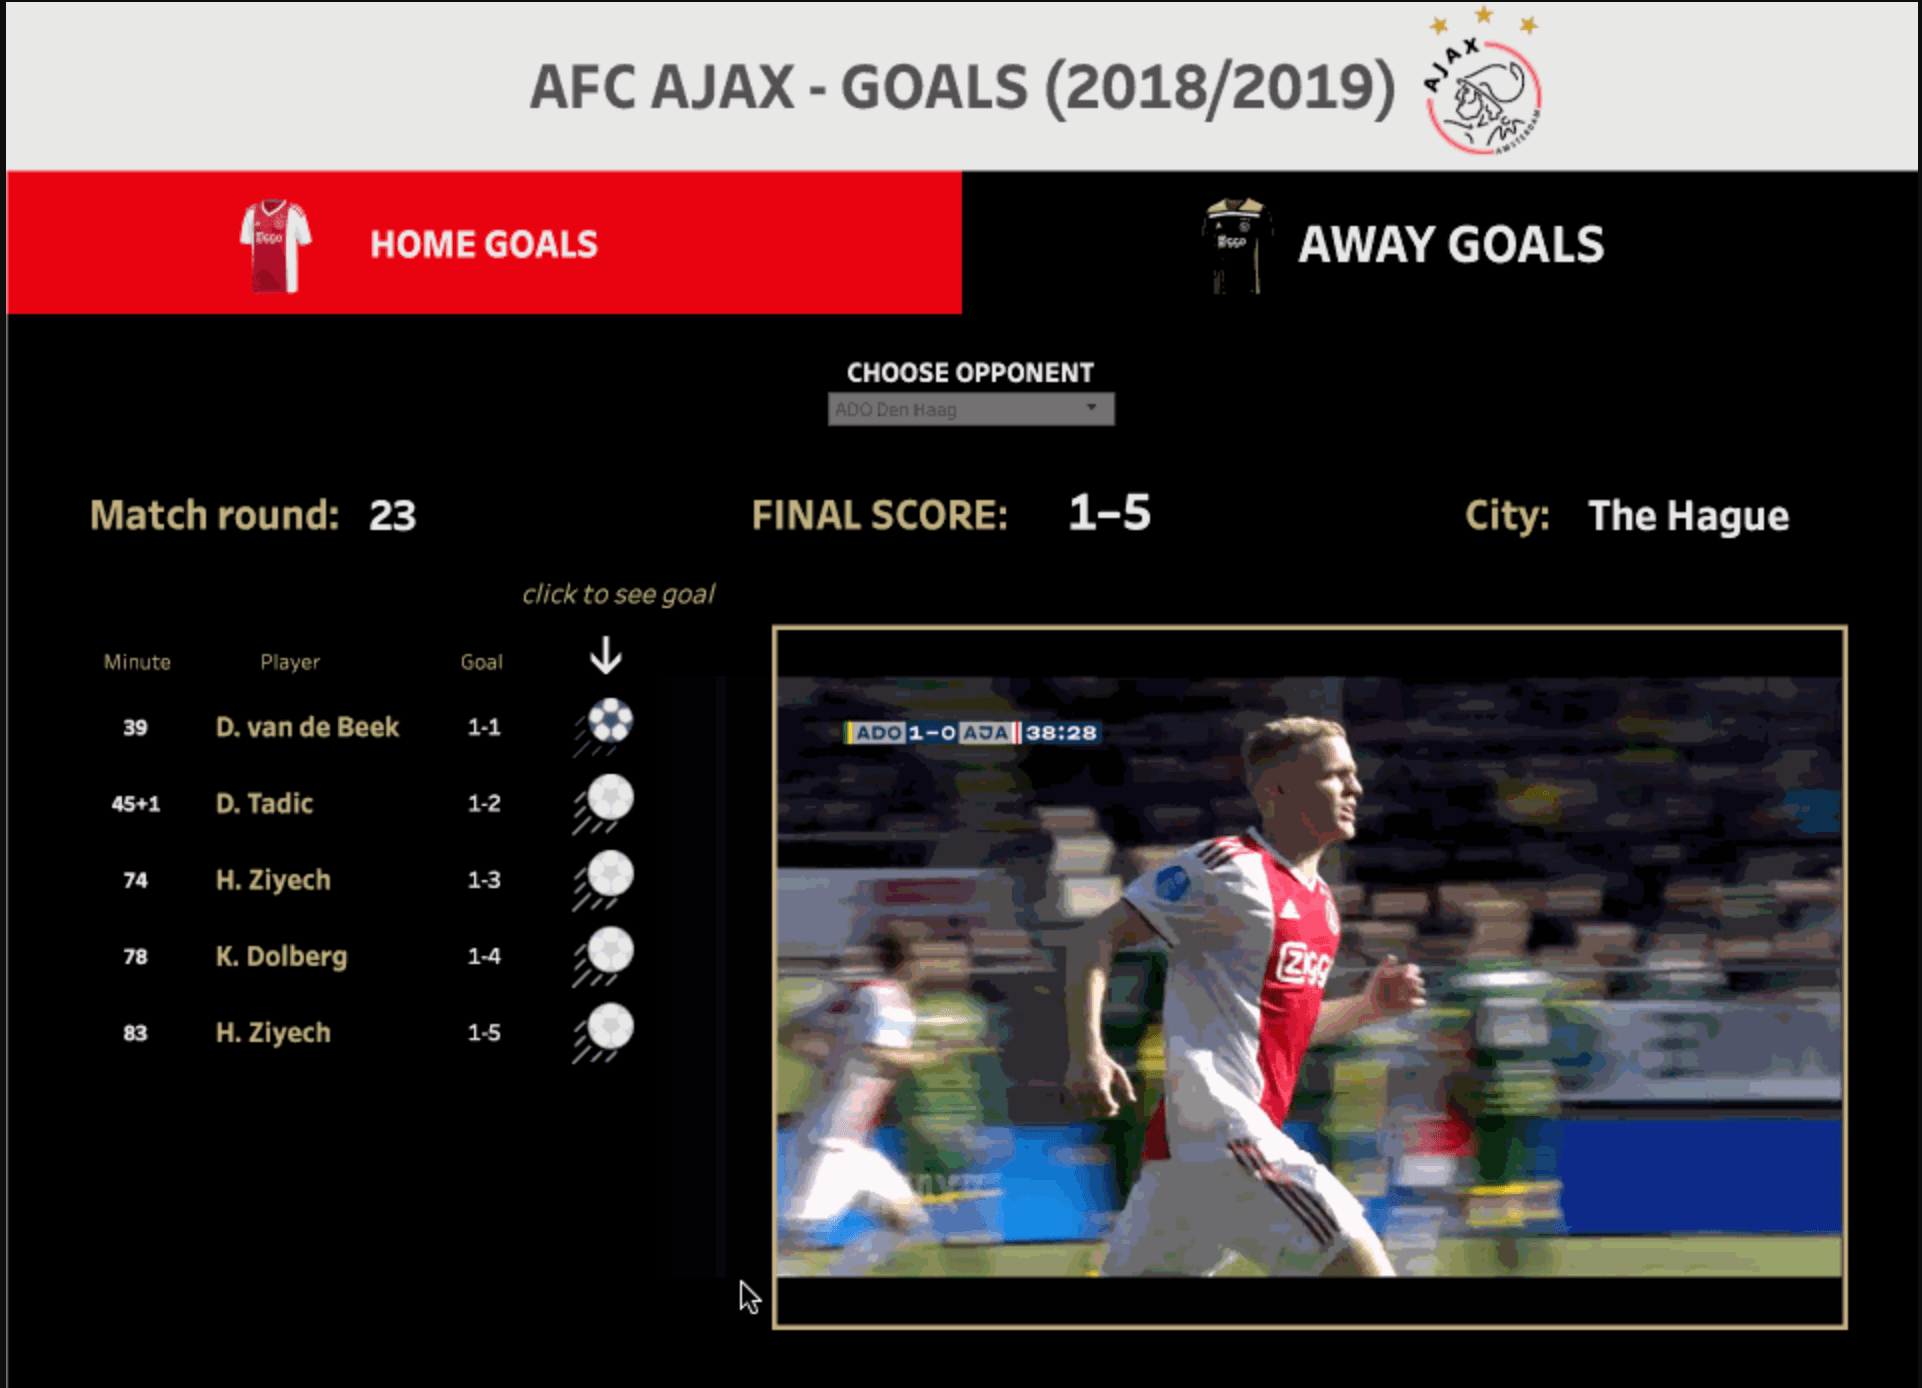
Last season Ajax scored 119 goals in the Eredivisie, which were the most goals scored by any Dutch team that year. As an Ajax fan myself, this was the...
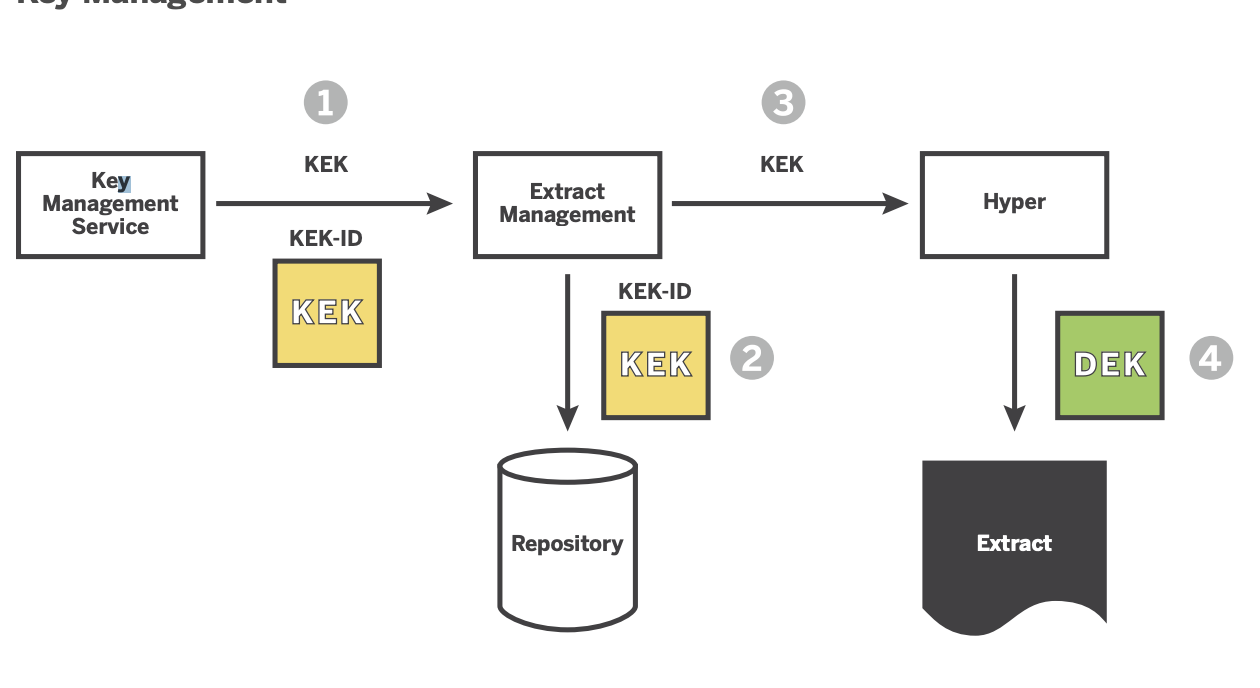
Data security is by far one of the topics that we have been asked to help with the most. One of the solutions we usually adopt is to encrypt...