

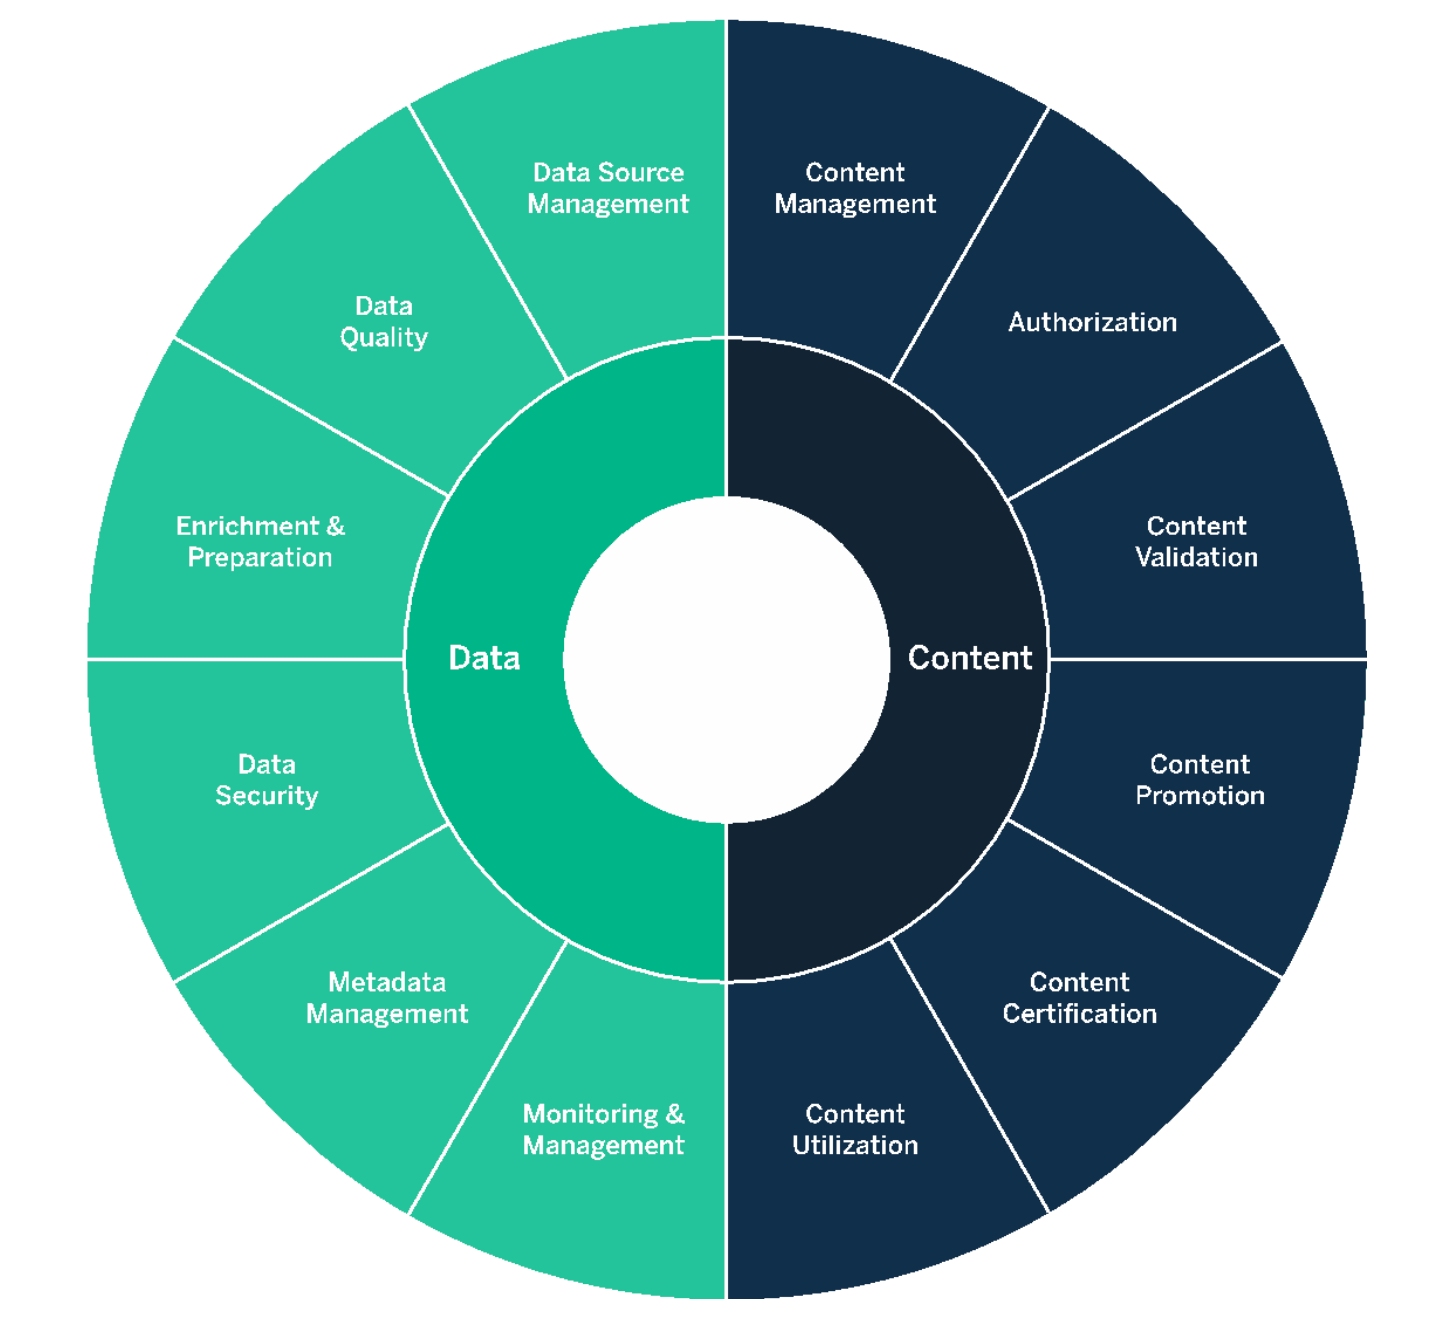
In order to be able to work in a data-driven way, it is important to consider the type of guidelines and processes to put in place. Although no two organisations are the same, the...
We regularly receive questions about how to monitor your default house style in a self-service BI environment. If you have hundreds of dashboards on your Tableau server, how can you...
One of the best ways to communicate your results/data is through pictures. In the world of football, one method you could use to do this, is to plot your...

Data collection, linking and preparation are not new terms for organisations these days. We have probably all started to visualise this collected data without actually doing it.
From 14 to 17 October, I attended Alteryx's Inspire Europe 2019 event in Tobacco Dock, London. Although it was only my first Inspire,...

With the results window, you can quickly and easily view the data in your workflow in Alteryx Designer. Since version 2019.2, the results window in Alteryx Designer is more interactive...
#MakeOverMonday is a concept in the data world. What is Make Over Monday? The idea behind #MakeOverMonday is to give an existing visualisation a Make Over. This visualisation...

The Big Data Expo 2019 was again a great success. We spoke to literally hundreds of people at the shared stands of Tableau and Alteryx. Many questions were about what...

Many of our customers use Tableau Server visualisations in their own customer portal. They do this by embedding Tableau visualisations in their existing customer environment whereby the authentication...