
In my previous blog post I made an attempt to make the Logshark application more user-friendly for the MacOS user. After testing with users, it became clear that the updated...

A particular period of history, especially one considered remarkable or noteworthy… The beginning of a new and important period in the history of anything… A milestone. These are a...
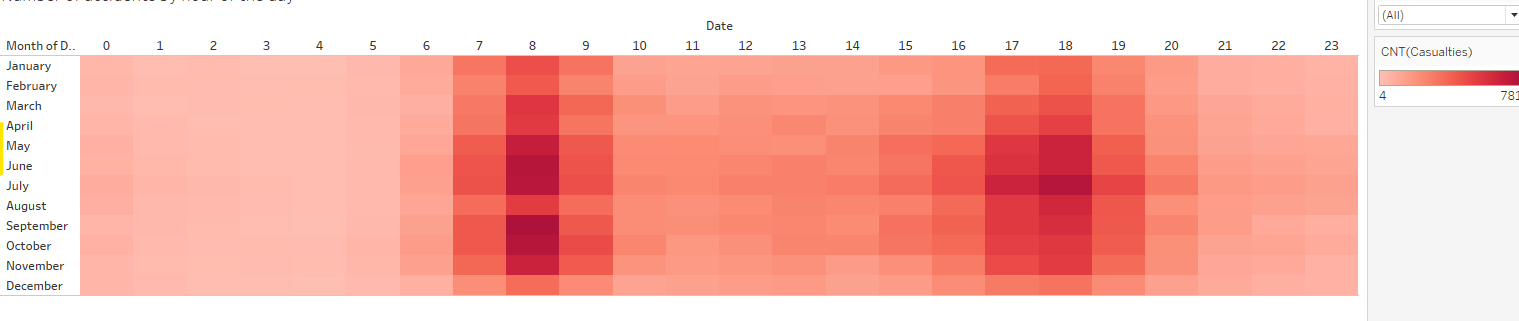
Combining times: a heatmap with two time axes Every organisation talks about growth, developments, trends. So you can compare the turnover of different years to find out what...

How to easily create a time animation in Tableau? You show beautifully the sales by quarter, by region, also you have a ranking in it, but still it doesn't look...

In the first dashboard I published on Tableau Public, I use a created set using a dynamic TOP-N filter. With this blog, I explain the...

You have just created two worksheets in Tableau Desktop and merged them into a dashboard. Now you want one of the visualisations - when you click on a data point there...

Time is a complex concept, even before you bring in Einstein's theories. Yet time is indispensable if you want to show developments or trends in your dashboards, or periods...
In this post, I would like to introduce you with data.world, a place where you can discover and access data to learn from and use it to drive your...
Did you know you can save your filters and selections in every dashboard in Tableau Server and Tableau Online? Learn how to do it in 2 minutes! Do you...