
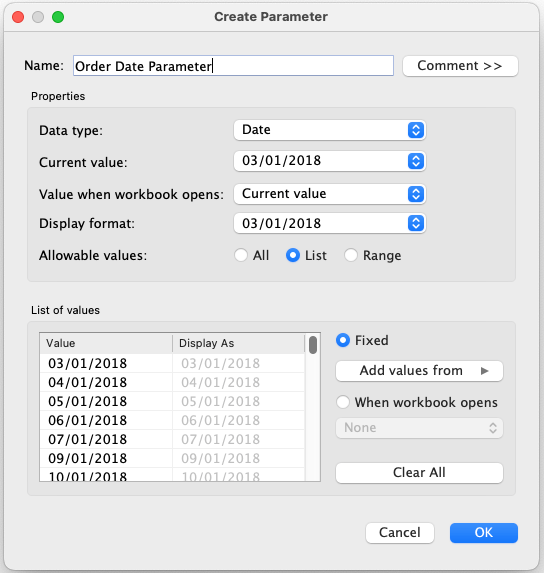
If you want to make your dashboards in Tableau interactive and allow the user to choose and select data, you soon come to parameters. In Part 1...

If you want to make your dashboards in Tableau interactive and allow the user to choose and select data, you soon end up with parameters. In part 1...
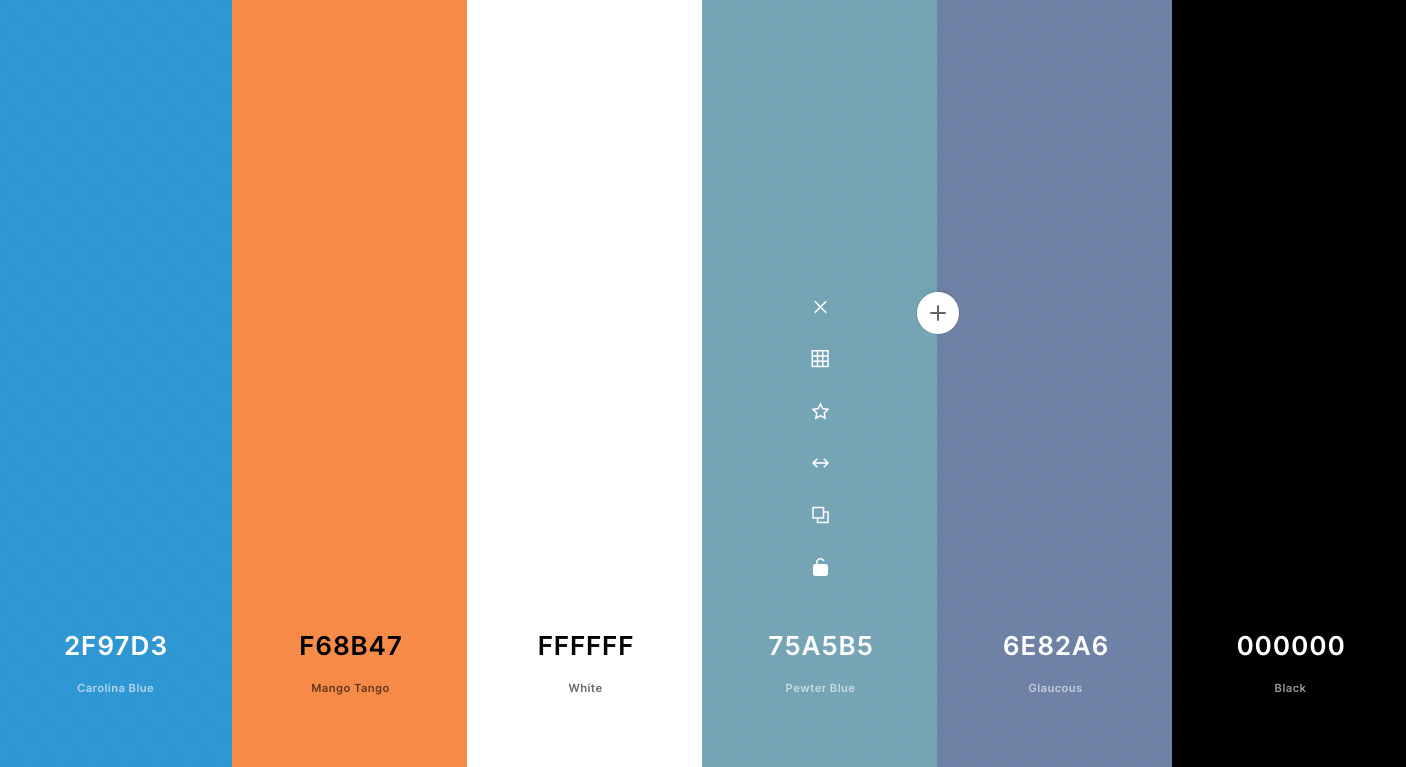
Colours are powerful tools for anyone who creates dashboards! Our brain registers colours long before the form and content of texts. Tableau, of course, already has a considerable...
5 reasons to use Alteryx Many organisations use different systems to store important business data. But even if all this data were in one system, it would not be possible to...

After a long slog, your visualisation is ready. Informative, intuitive, clean and... boring? Tableau's white background is practical, but not always the most visually appealing option. How do you add...
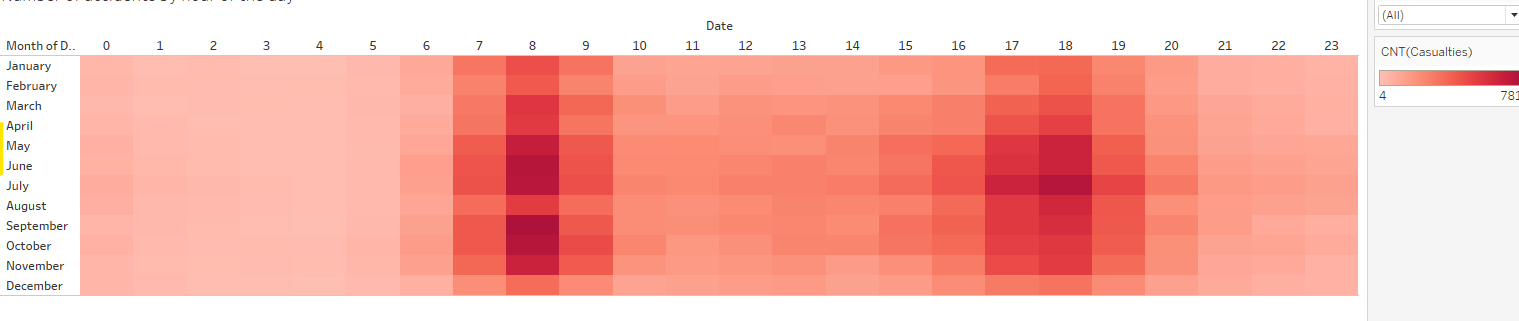
Combining times: a heatmap with two time axes Every organisation talks about growth, developments, trends. So you can compare the turnover of different years to find out what...

Time is a complex concept, even before you bring in Einstein's theories. Yet time is indispensable if you want to show developments or trends in your dashboards, or periods...