
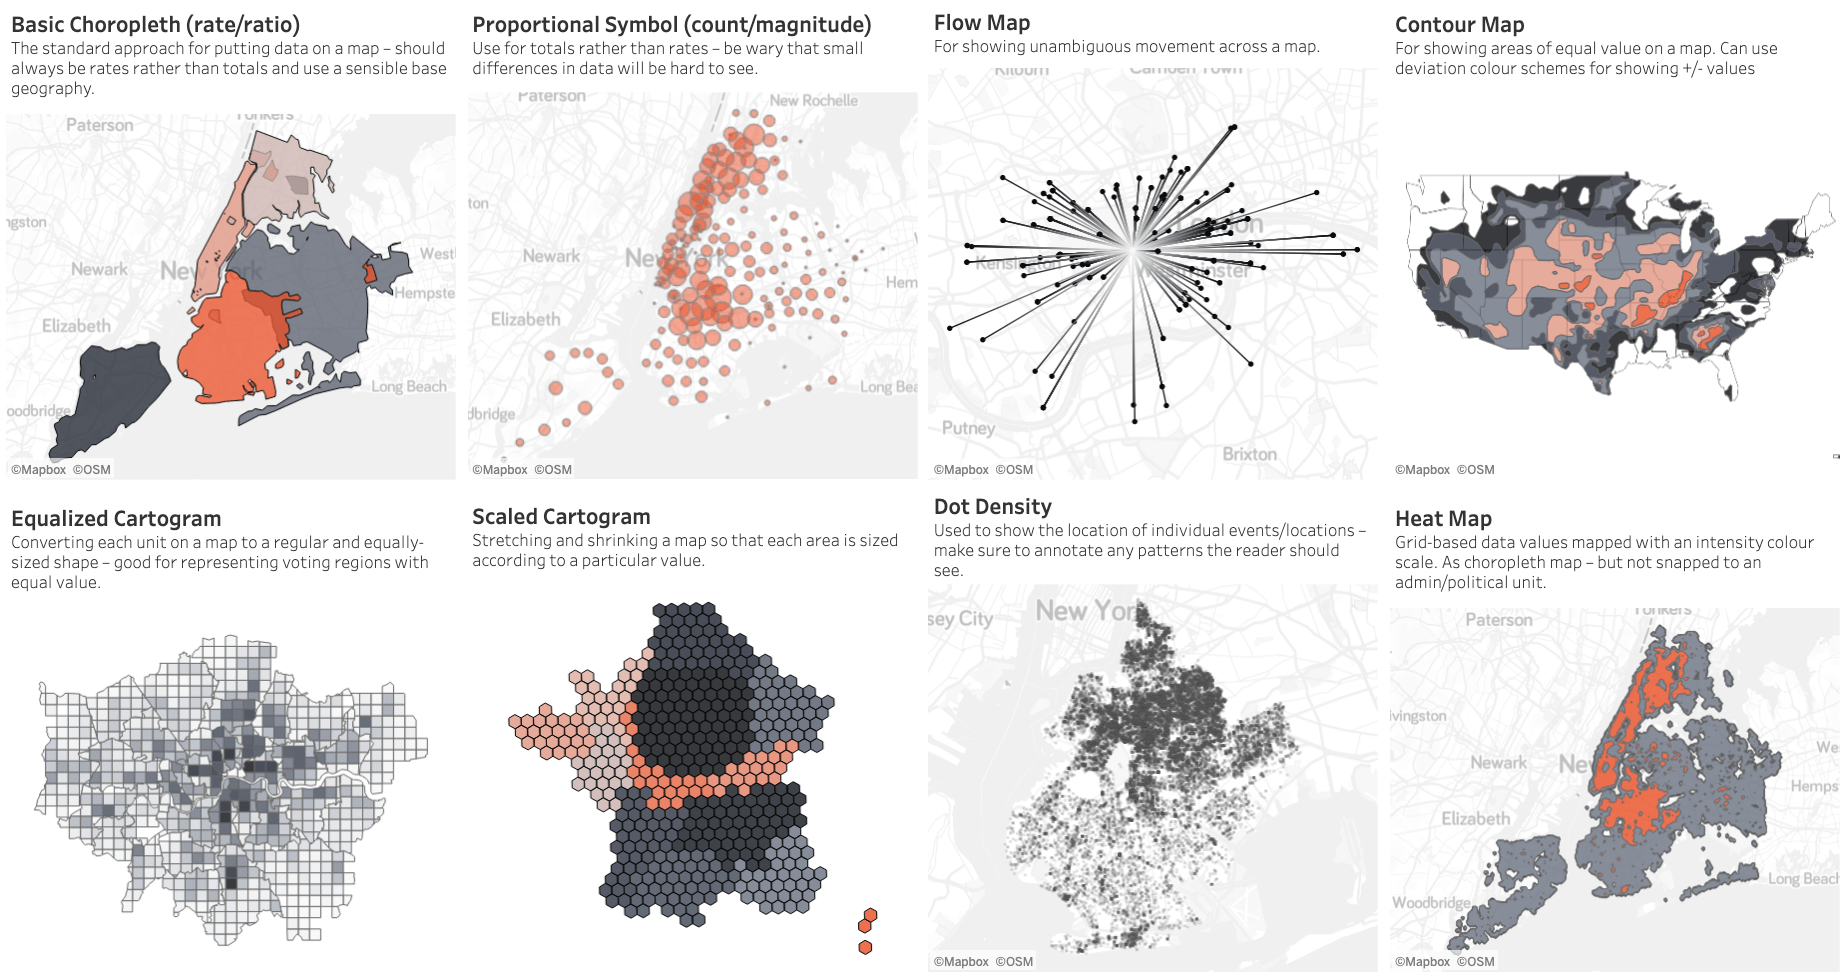
There are so many ways to visualize data - how do we know which one to pick? Zen Master and head of The Dataschool, Andy Kriebel, is always there....
The easiest way to highlight certain parts of your chart is to use the Highlighter function. When you right-click on a dimension and...
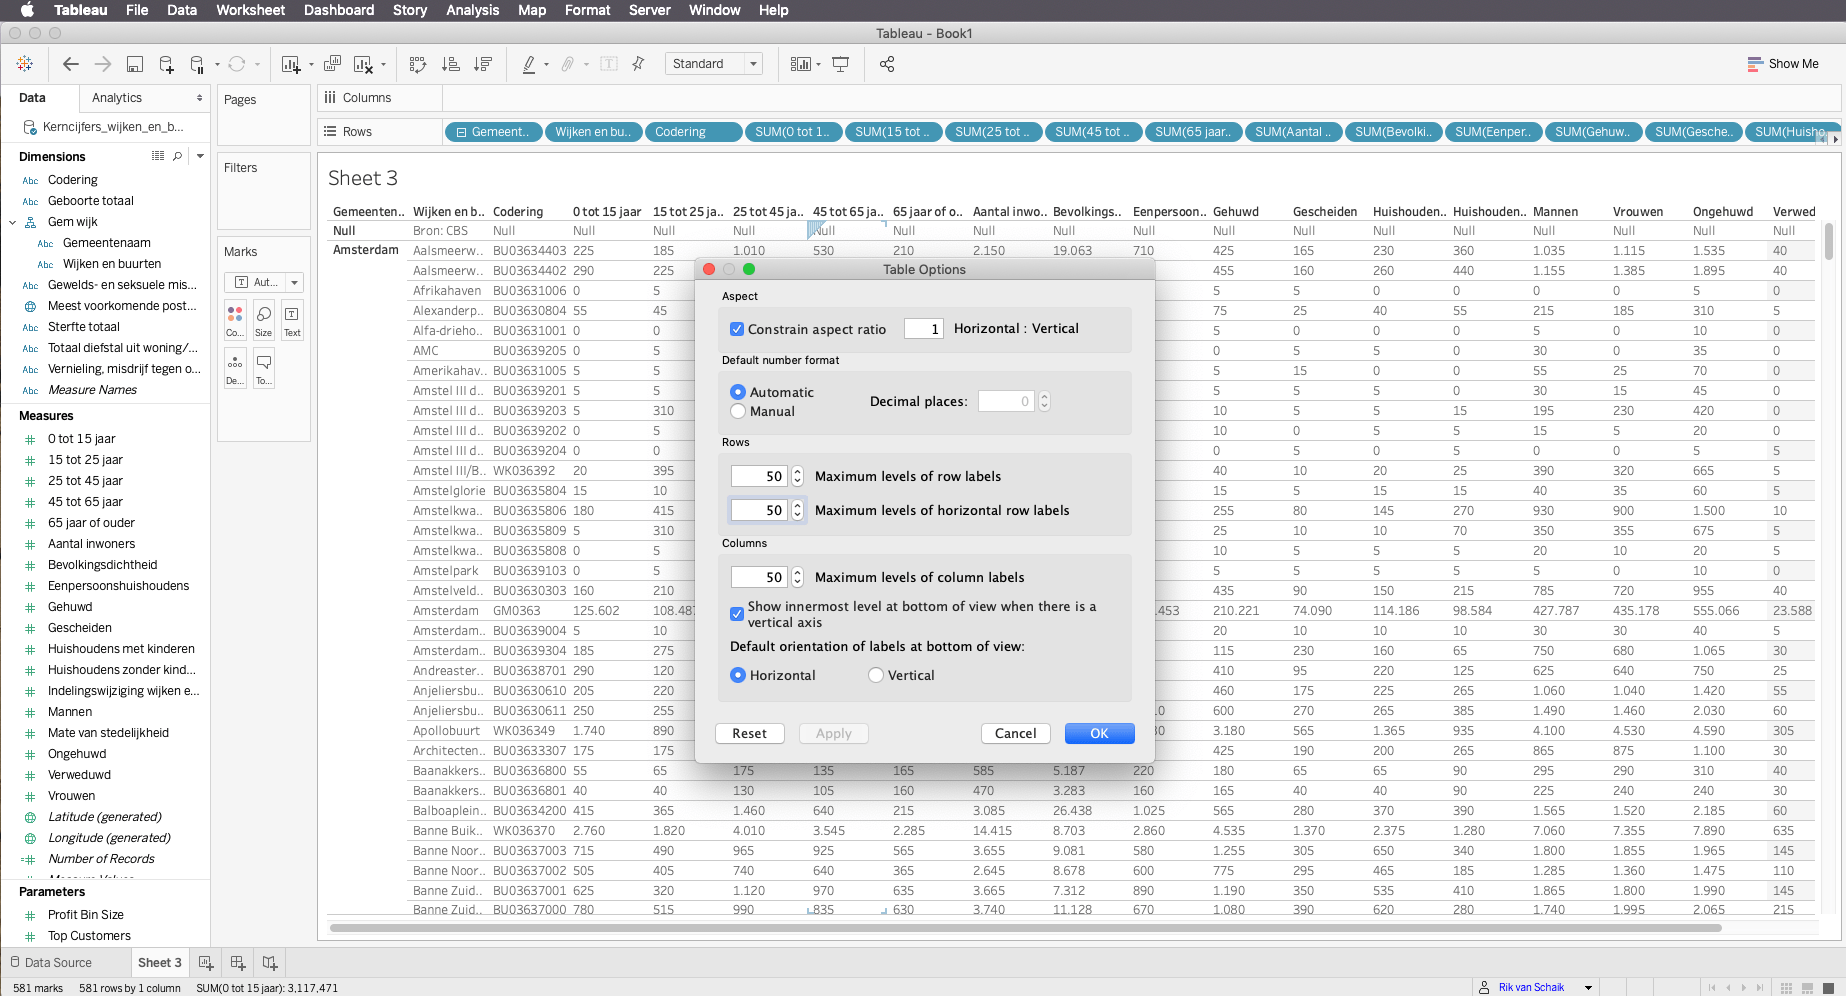
First question with me is why would you want to use very large tables? Yet we encounter it fairly regularly in various departments, but remarkably more often in financial...
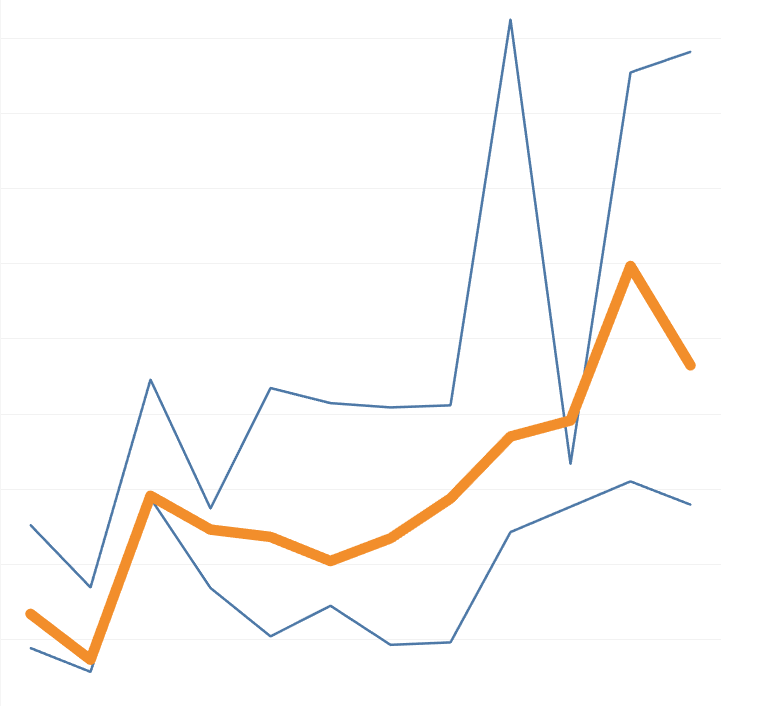
For a Football dashboard I recently made, I wanted to highlight my line graph by using a parameter. This blog contains a step by step explanation of how to...
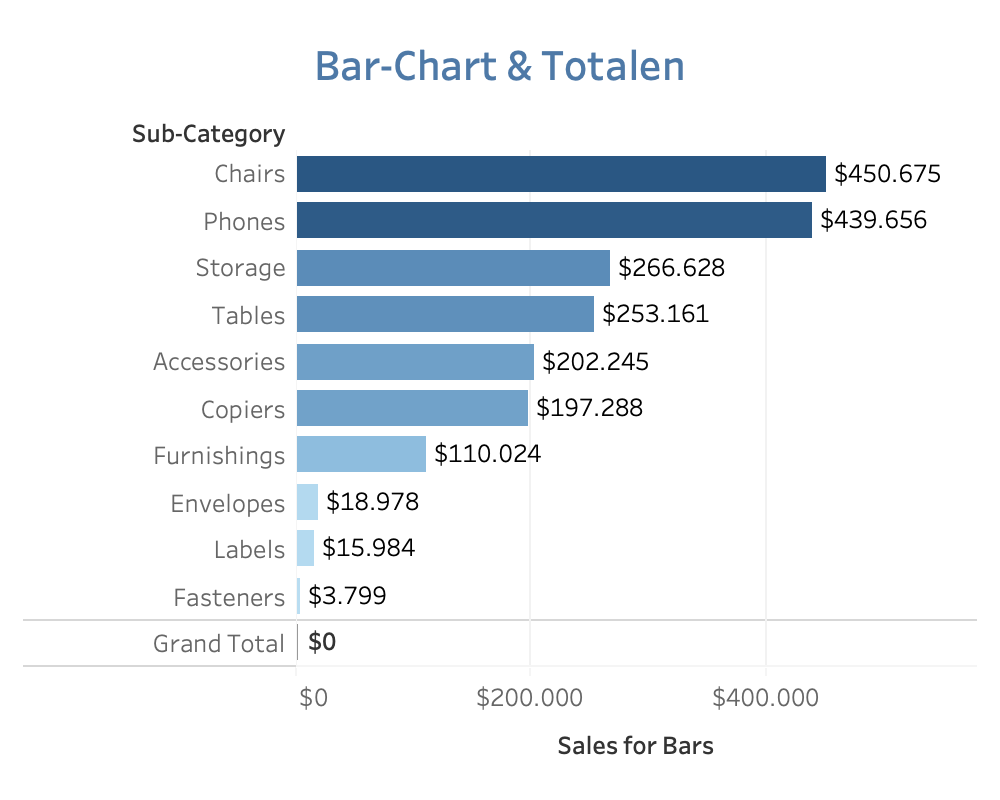
Adding sub-totals and totals can have a big impact on the rest of the chart/bar chart. This article offers a simple solution to reduce the impact of...
Adding sub-totals and totals can have a big impact on the rest of the chart/bar chart. This article offers a simple solution to reduce the impact of...
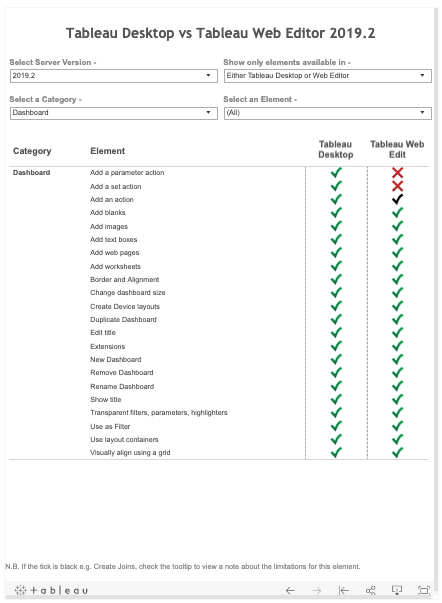
You can create and customise visualisations and dashboards with both Tableau Desktop and the Web Edit environment. But there are certainly differences. We always recommend that data analysts use...

On Tuesday 18 June, at the annual European Tableau Conference in Berlin, a number of new Tableau features were revealed during the Keynote. These features will be included in the upcoming version of...

On Tuesday 18 June, at the annual European Tableau Conference in Berlin, a number of new Tableau features were revealed during the Keynote. These features will be included in the upcoming version of...