

It has been a little over a month since I attended this year’s Tableau Conference in sunny San Diego. It was my first time experiencing the conference in all...

It took me a while to be able to experience the Tableau Conference, to be precise almost 9 years! But finally I made it and I could not hope...
Wie de Gardner Magic Quadrant voor 2023 bekijkt, ziet wat hij of zij waarschijnlijk al wel wist: Tableau (Salesforce) en Power BI (Microsoft) steken met kop en schouders boven...
Wie de Gardner Magic Quadrant voor 2023 bekijkt, ziet wat hij of zij waarschijnlijk al wel wist: Tableau (Salesforce) en Power BI (Microsoft) steken met kop en schouders boven...

Imagine you’re creating a chart and you want to add a certain shape or icon that is not available in Tableau’s default shape palette. For example, what if you...
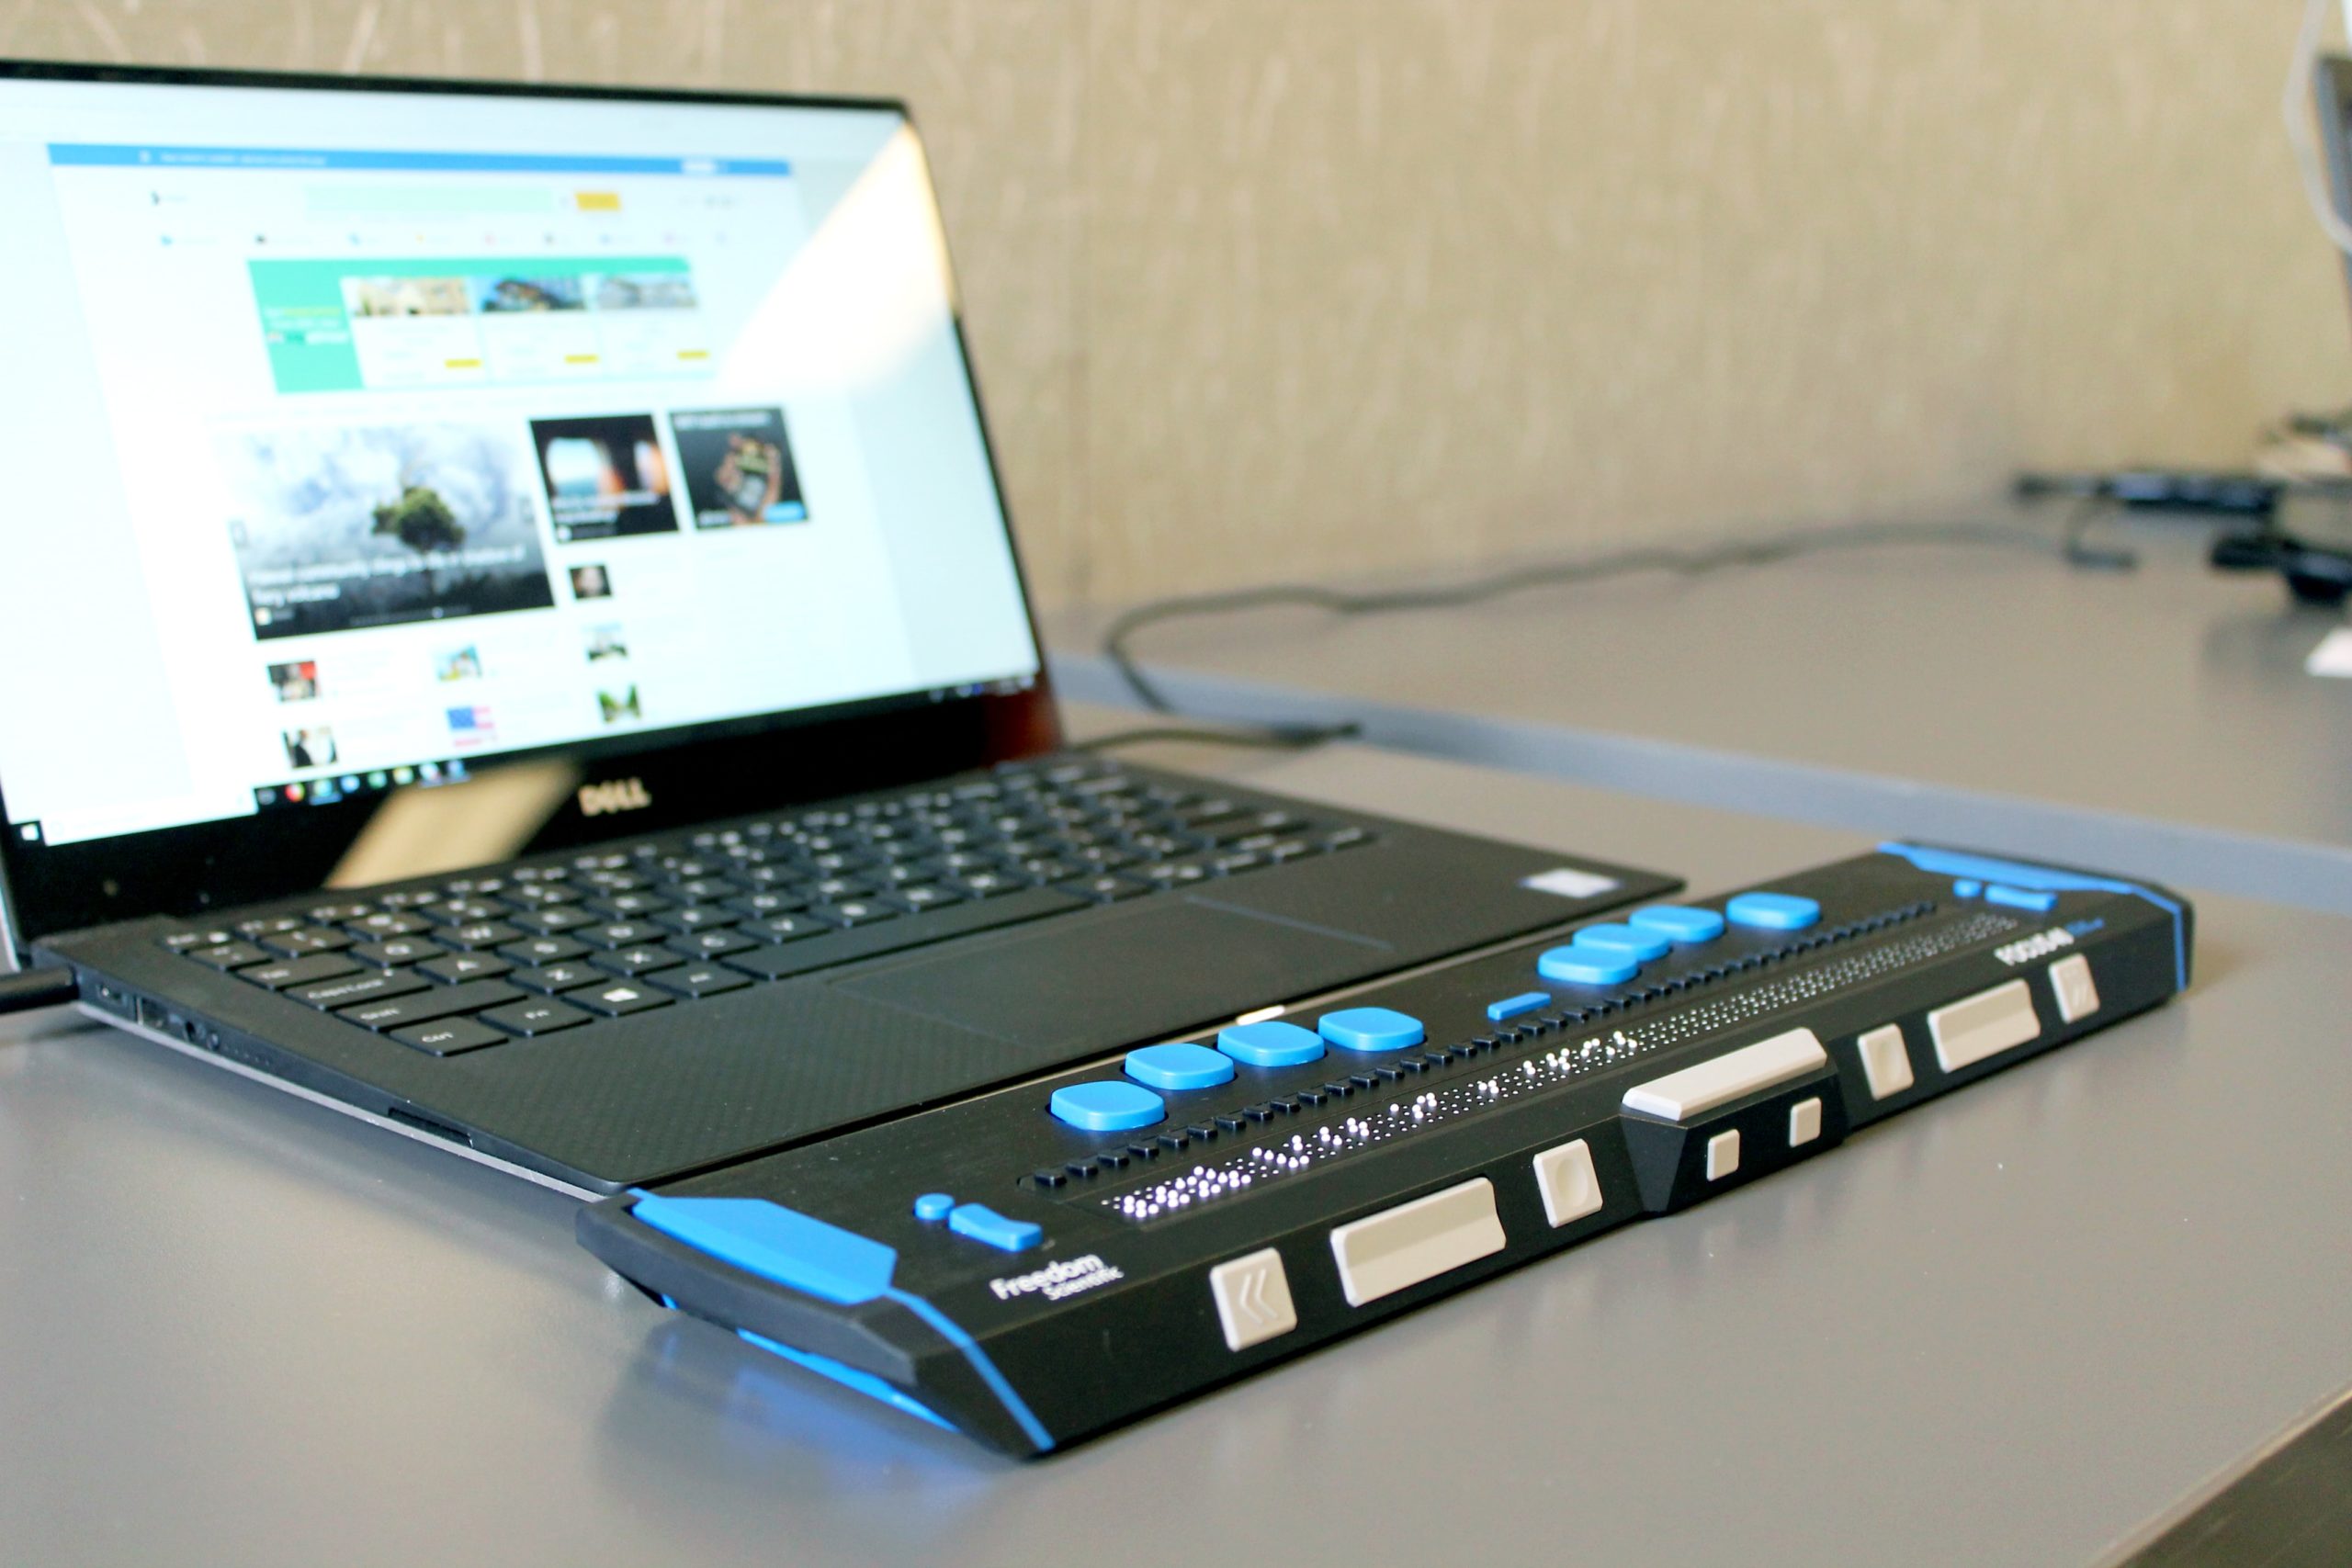
In a time where data-driven decisions shape our world, it’s crucial that data visualisations are accessible to everyone. Many BI tools offer a wide range of features to ensure...

It’s that time of the year again. The days are getting shorter, the nights are getting colder and if you live in the Netherlands, the kruidnoten are already in...
A fundamental aspect of creating impactful visualisations in Tableau involves using calculations. Tableau offers three main types: Basic Calculations, Table Calculations and Level of Detail (LOD) calculations. Each type...
TC23, de Tableau conferentie van dit jaar, is alweer even achter de rug. Zo’n 8000 leden van de #DataFam kwamen samen in de wonderlijke wereld die Las Vegas heet....