
A fundamental aspect of creating impactful visualisations in Tableau involves using calculations. Tableau offers three main types: Basic Calculations, Table Calculations and Level of Detail (LOD) calculations. Each type serves distinct purposes, but it can sometimes be difficult to understand when to choose the right type of calculation in Tableau. This blog will give you a good insight to these calculations and explore scenarios where each is the most useful.
Basic Calculations
These types of calculations involve mathematical operations, string manipulations, logical expressions and more. They are ideal when you want to transform and shape your data to suit your visualisation. And they can be seen as the building blocks of more complex calculations.
When to use them?
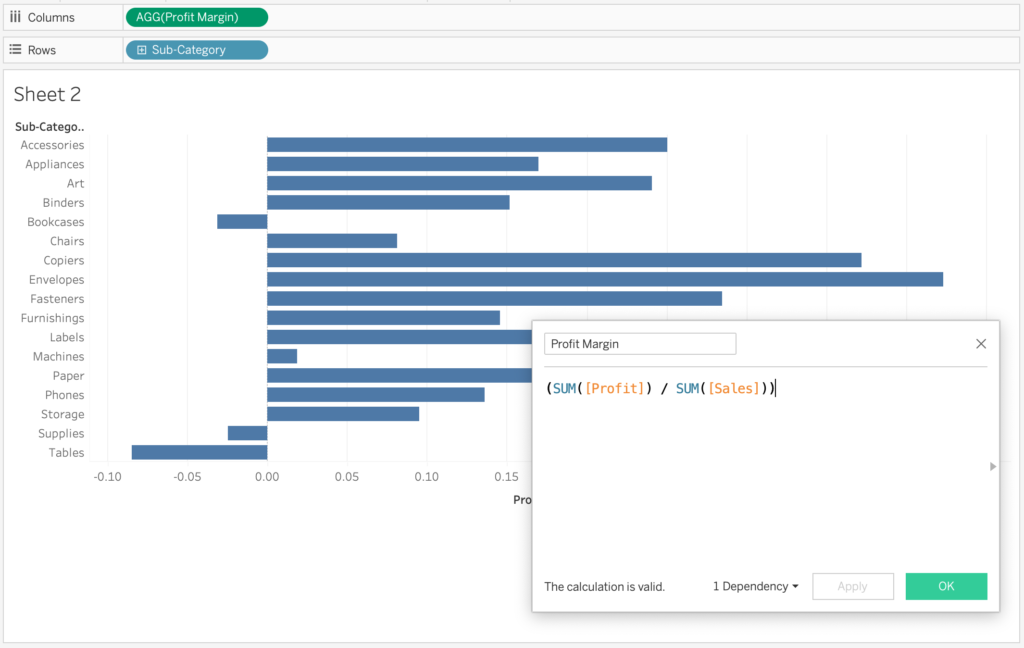
- Data Transformation: When you need to transform raw data to create new variables or dimensions, basic calculations are your go-to. Examples include creating age buckets, concatenating strings or calculating profit margins (see image below).
- Filtering and Segmentation: Basic Calculations can help in creating custom filters or segments based on specific conditions, which you can then utilise in your visualisations.
Table Calculations
Table Calculations in Tableau allow you to perform computations across rows, columns within the visualisation. Thus, they do not consider fields that aren’t in the visualisation. They are calculated on the results of a query and best suited for scenarios where you need to enhance the dynamic nature of your visualisation.
Here’s when you should opt for Table Calculations:
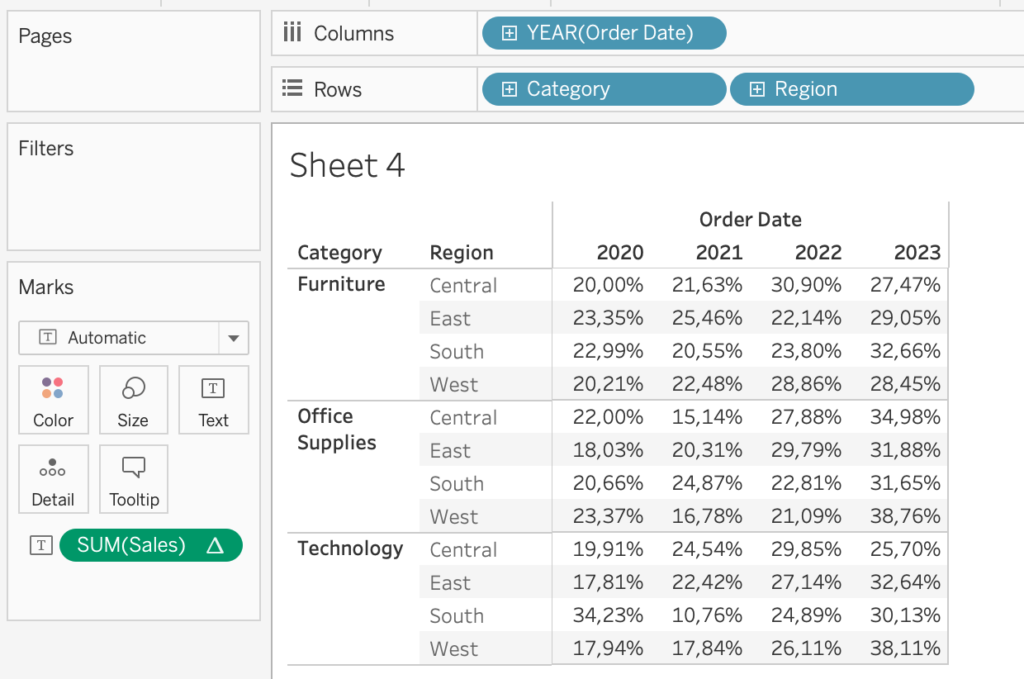
- Running Totals and Percentages: Use Table Calculations when you want to calculate running totals, cumulative metrics or percentages (see image below) which evolve as you navigate through the visualisation.
- Custom Aggregations: When pre-defined aggregations don’t meet your needs – that is, the calculation options that are already provided – Table Calculations give you the flexibility to create custom aggregations and formulas.
Level of Detail Calculations
LOD calculations in Tableau are a way to define a scope within a visualisation – similar to zooming in and out. They allow you to compute measures at different levels of detail (granularity) than the visualisation’s level.
When to use LOD calculations:
- Comparing Across Dimensions: LOD calculations are ideal when you want to analyse data at a higher level of aggregation while retaining insights from lower-level dimensions.
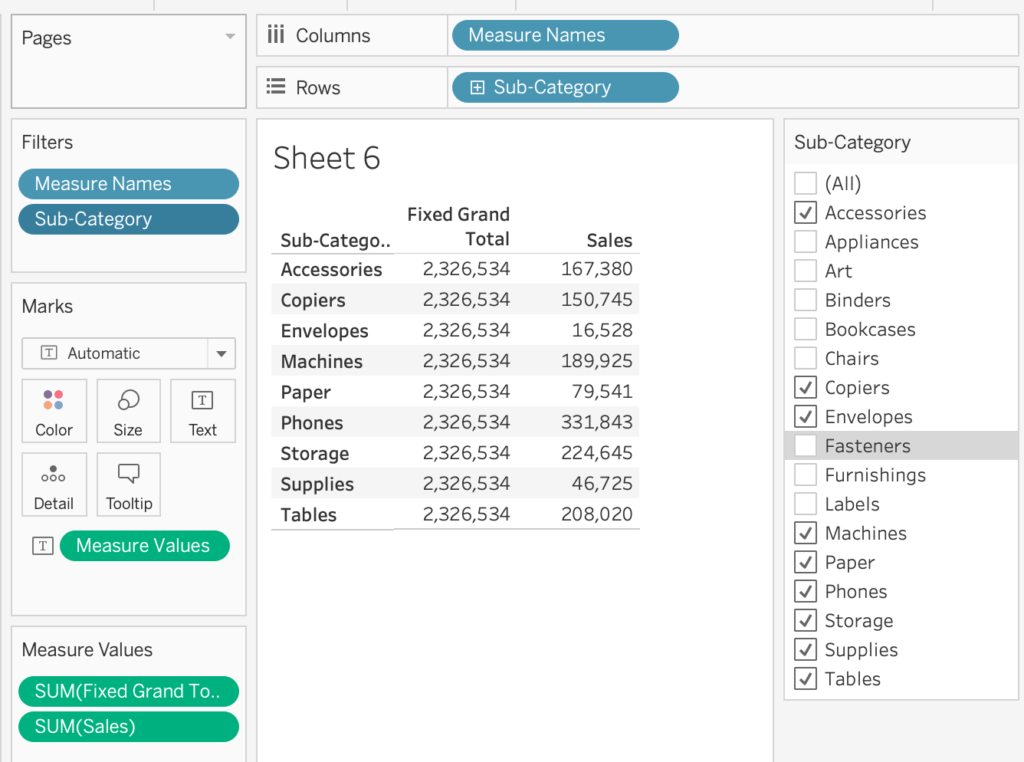
- Nested Aggregations: When you want to use an LOD expression within another aggregation. For instance, when you want to calculate the average sales per customer across different regions.
This blog showed a high-level explanation of the different types of calculations in Tableau and when to use them. Be sure to check out other blogs and resources to help you gain a deeper understanding of these types of calculations. Happy visualising!