
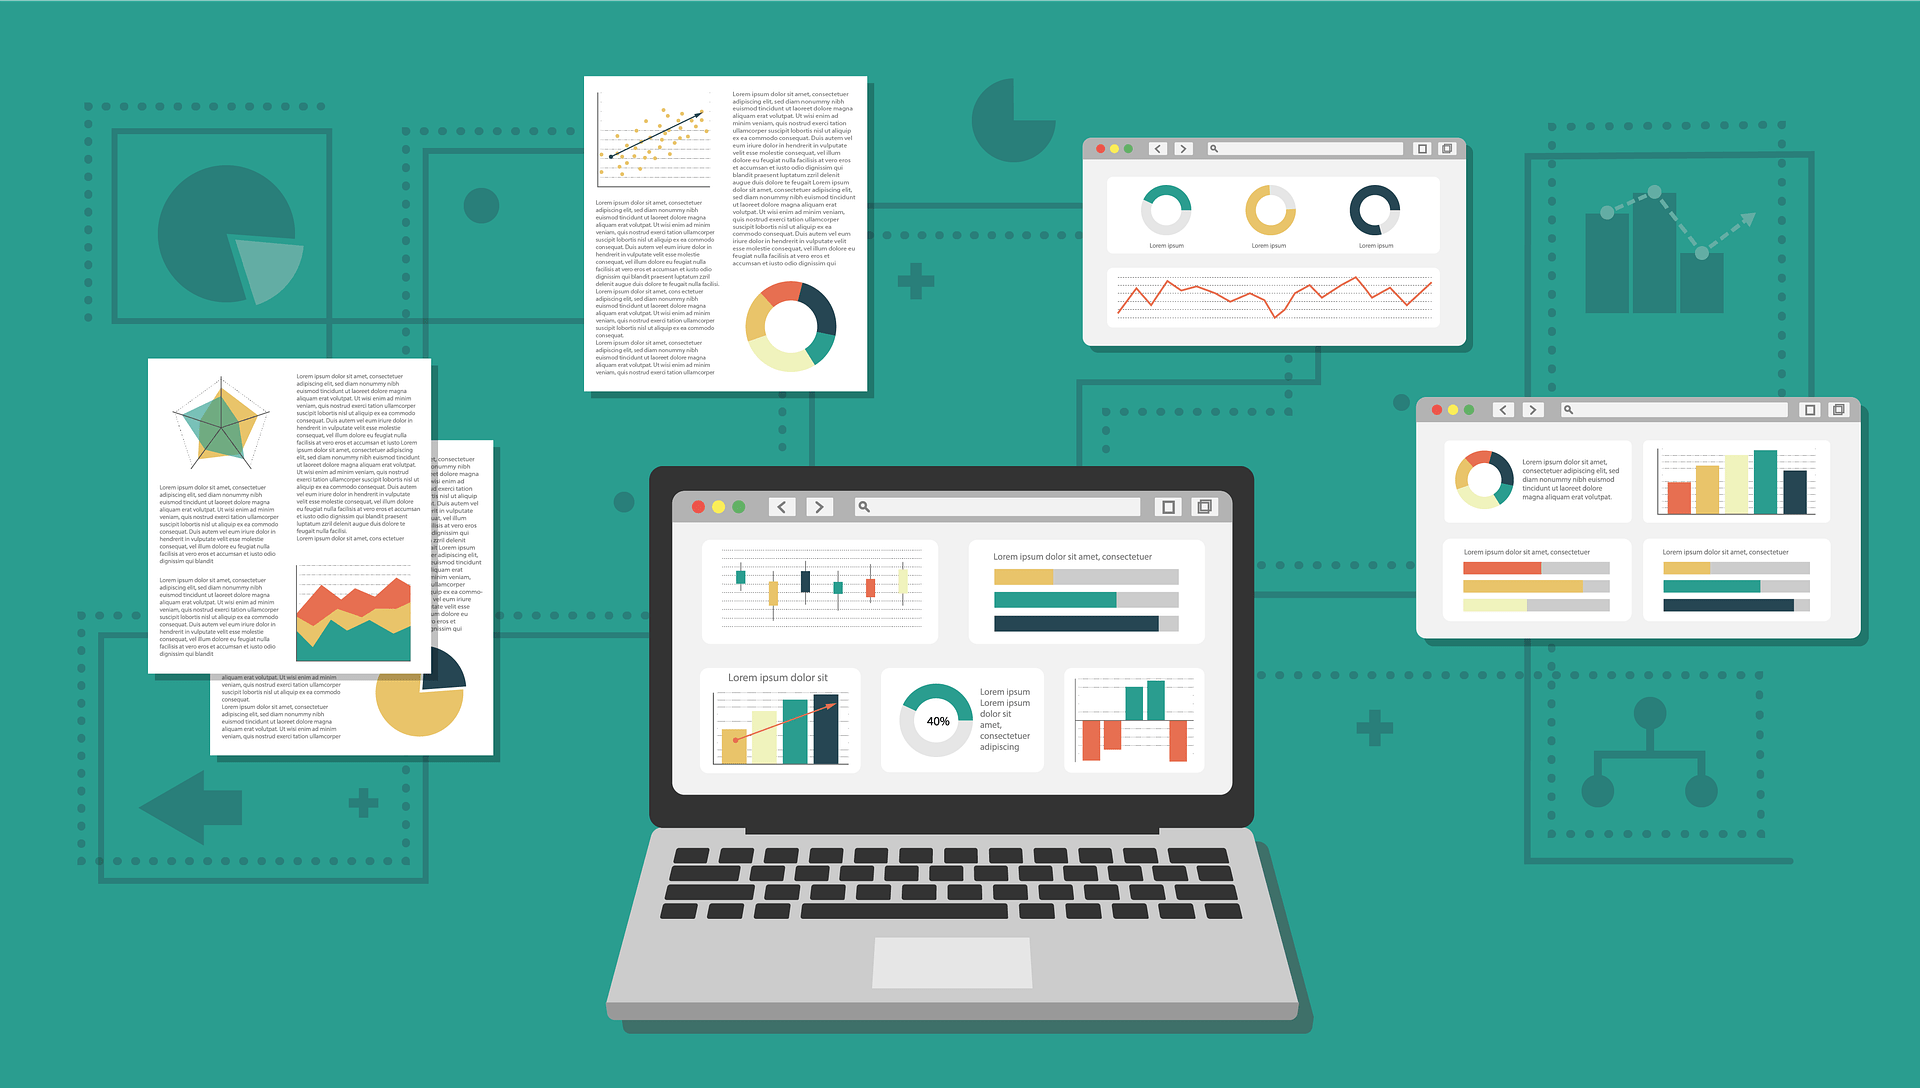
Data visualization is a crucial aspect of modern data analysis, and Tableau has long been a go-to tool for creating beautiful and informative visualizations. With the release of Tableau...

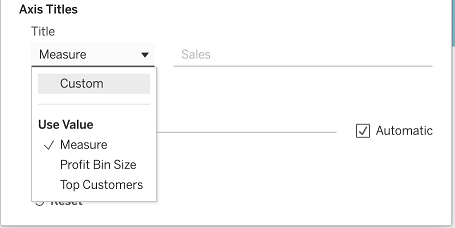
Suppose a dashboard needed to show how many hours were spent per role/function in a project. The dashboard needed to show what the...
How do you keep the departments of HR, who wants to see hours worked by month, and Finance, who wants to see everything with ISO? In other words, how do I get hours worked in months and...
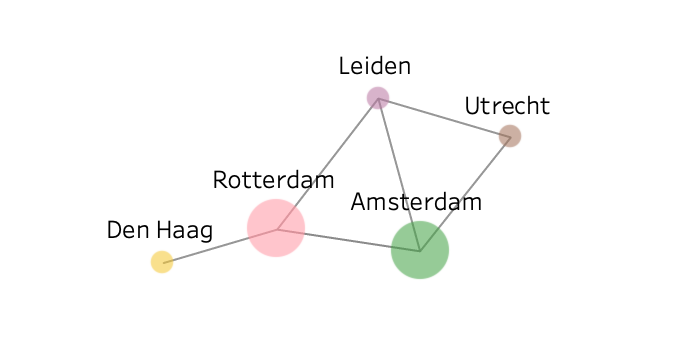
A network graph (also known as a link chart, a node-link diagram, a network map, or just a graph) represents a collection of interlinked entities. This type of graph...

Yesterday I was lucky to attend the latest Data+Woman Zurich organized by Annabelle Rincon and Olivia Sliz. In this sweet event, we had the pleasure to be presented with...
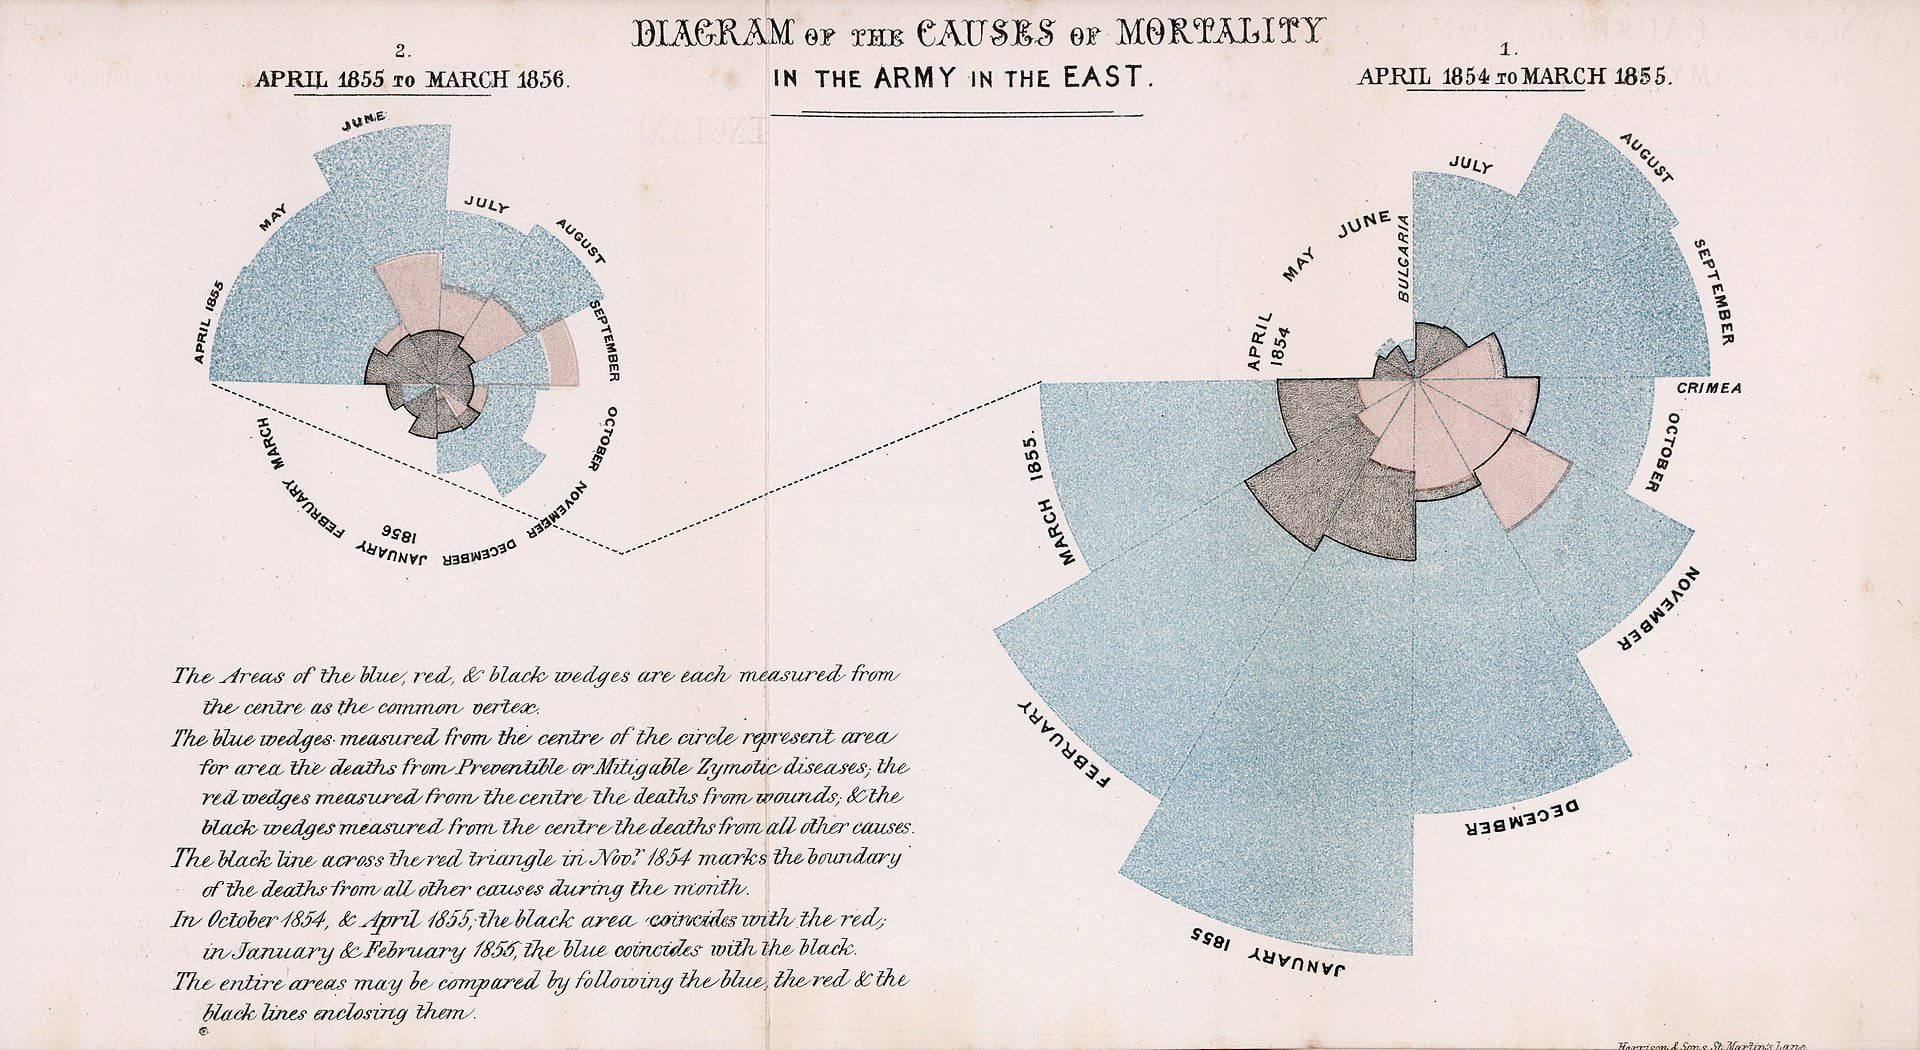
Tableau, Power BI, Qlik Sense, visualizing data has never been easier or more widespread. Yet data visualizations are not exactly a modern invention. In fact, the ancient Egyptians...

Cognitive load is the amount of work the short-term memory has to do to perform a given task. As long as enough memory space is available, tasks are not a problem....
Earlier this month, I followed the Tableau Visual Analytics training (TVA in short). TVA is a live virtual training that helps you discover the science behind the art of...
Visualizing data is a powerful way to convey information. But with the same power, consciously or unconsciously, you can also present false information convincingly. These are...