
Introduction
In the dynamic finance landscape, leveraging data through APIs has become indispensable for making informed decisions. If you ever wondered if it was possible to connect to an API, (Yahoo Finance API in this case) directly through Tableau Desktop to pull live data and build visualizations. This guide will be for you.
In this how-to guide, we will be going through how to use the Yahoo Finance API directly from Tableau without the use of a database to store the data. This unusual method makes use of the analytic extension called Tabpy and table extensions. Therefore, we will not only be using Tableau for this one but a little bit of Python as well.
In this blog, I will not go through how to set up Tabpy on Tableau Desktop or Server. I will however provide the link that goes through the setup of this:
How to set up Tabpy in Tableau: https://www.theinformationlab.co.uk/community/blog/how-to-set-up-tabpy-in-tableau/
In the tutorial, I will use Tableau Desktop therefore I will run Tabpy locally and use Tableau Desktop.
Prerequisites:
- Tableau Desktop
- Tabpy (Analytics Extension)
- an IDE (optional)
- Some Python knowledge
- Python Packages:
- pandas
- yfinance
- datetime
To see the final Visualisation, visit the Tableau Public page here. Note: This dashboard is not live, since to post on Tableau Public, you need to extract the data. However, the configurations of the table extensions still can be viewed after downloading. I will not be going through in detail how I configured all the visualizations in the dashboard. The focus will be more on how to make the connection and pulling the data first.
Set up and Run Tabpy
So first things first is to install Tabpy, please follow the link provided in the introduction if you don’t have it installed on your machine (or server). Once it is installed, it needs to be running. So go to your terminal and type in tabpy to launch it.
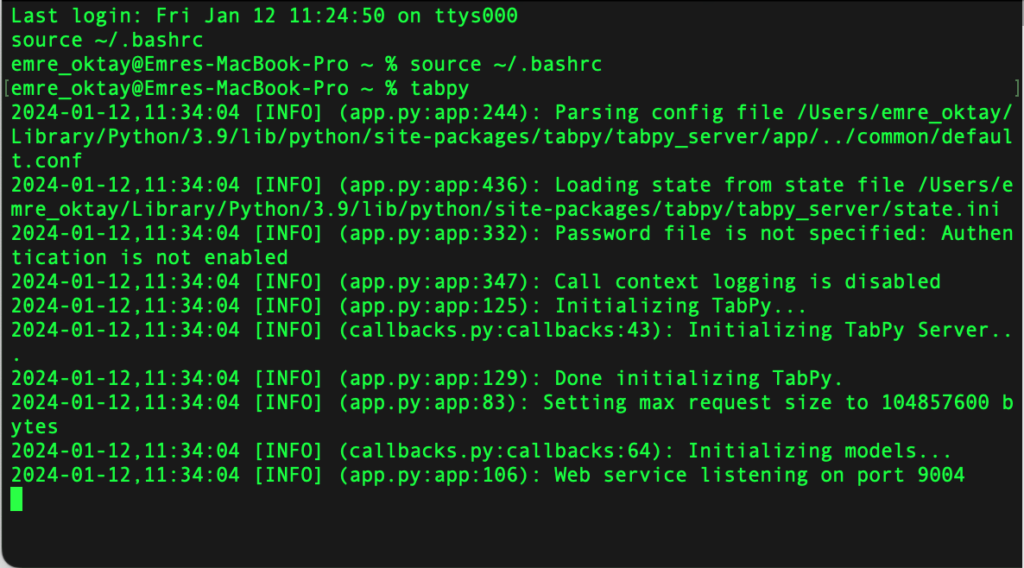
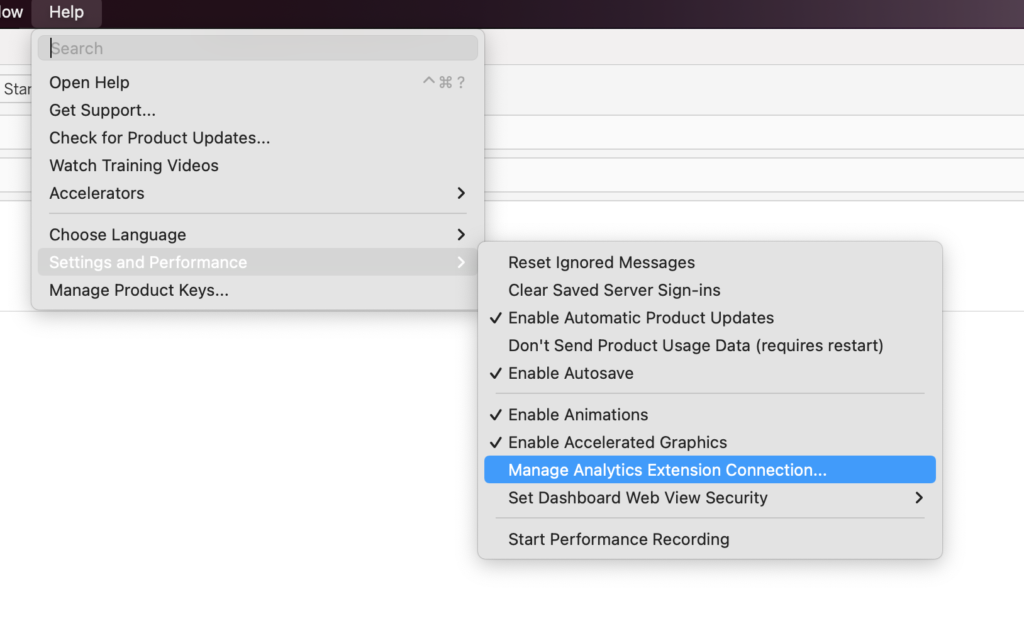
The web service is listening on port 9004 by default. Therefore the next step is to connect Tabpy to Tableau. Upon Launching Tableau Desktop, head over to Help > Settings and Performance > Manage Analytics Extension and Connection
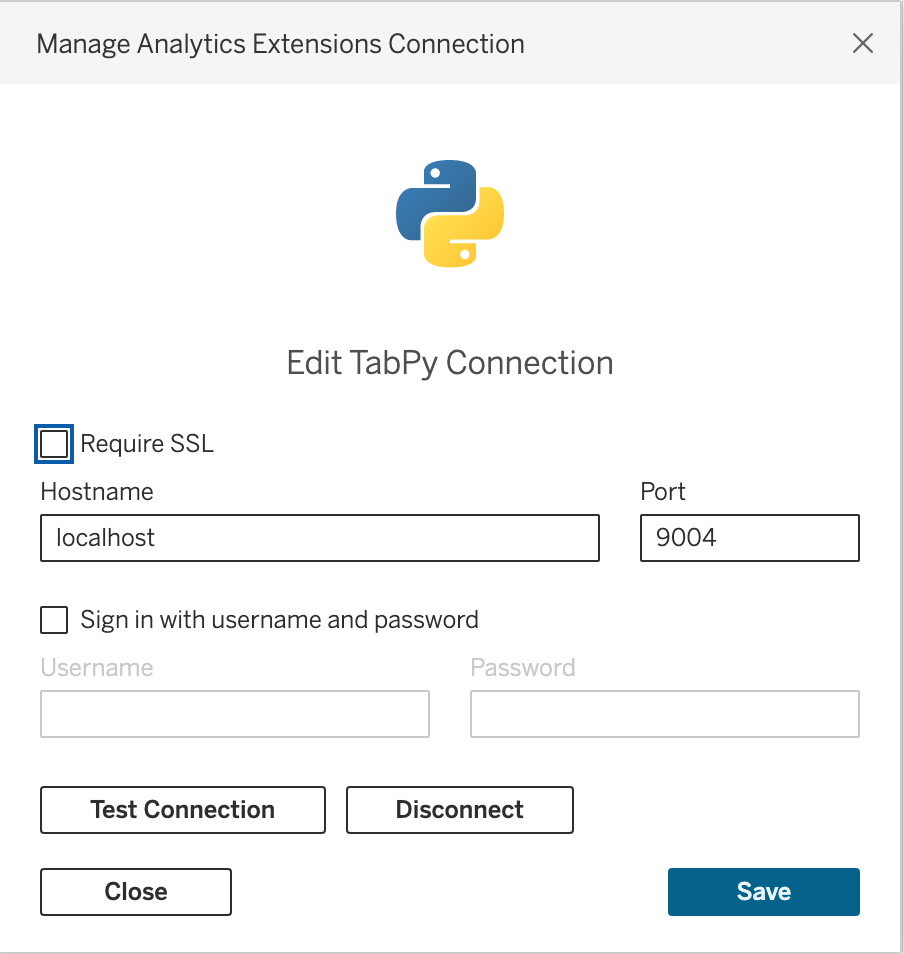
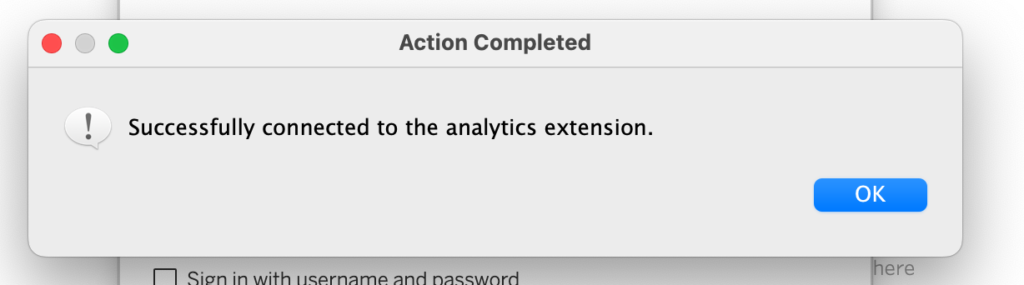
From the pop-up, make sure the hostname and the port match localhost and 9004. To make sure if the connection is working you can test it as well. Once the connection is made, we are ready to take the next step.
Write the Code and Retrieve the Desired Data
Now that Tabpy is set up and running, the next step is to write the code to retrieve the data that we desire from the Yahoo Finance API. In this step, I would recommend using an IDE like Visual Studio Code to develop the code. In my opinion, it works better to use a tool like this than to develop the code within Tableau right away. I am using Visual Studio Code with the Jupyter Notebook extension.
There is a great guide on how to work with the Yahoo Finance API in general, which I have used extensively for this project: https://algotrading101.com/learn/yahoo-finance-api-guide/
My goal in this part is to get the stock information of four companies of “Microsoft”, “Snowflake”, “Salesforce” and “Alteryx” for the past 52 weeks. To connect to the Yahoo Finance API, we will also need to import the package yfinance. So make sure you also have this installed from your terminal. Also the packages pandas and datetime are necessary to do relative date calculations and making dataframes.
Full Code
To start, we shall import the necessary packages:
#import the necessary packages

import pandas as pd

import yfinance as yf

from datetime import date, timedelta
Next is to define a list of tickers that we want to pull the information from and set the time period, which is 52 weeks from today’s date:
#define the list of tickers that you want to pull information on
ticker_list = ["crm", "msft", "snow", "ayx"]

#define the time period in which you want to pull data from
end_date = date.today()
start_date = end_date - timedelta(weeks=52)
Next, we are going to make an empty list where we store the dictionary of stock information for the company tickers from the list before. To do this we will write a for loop. I will pull the ticker name, the date, open, close, high, low, and volume values of the four companies.
# Initialize an empty list to store dictionaries
data_list = []
# Fetch historical data for each ticker
for ticker in ticker_list:
    try:
        stock_data = yf.download(ticker, start=start_date, end=end_date)
        for index, row in stock_data.iterrows():
            # Create a dictionary for each row of data
            data_dict = {
                'Ticker': ticker,
                'Date': index,
                'Open': row['Open'],
                'High': row['High'],
                'Low': row['Low'],
                'Close': row['Close'],
                'Volume': row['Volume']
            }
            # Append the dictionary to the list
            data_list.append(data_dict)
        print(f"Downloaded data for {ticker}")
    except Exception as e:
        print(f"Failed to download data for {ticker}: {e}")
Now we should have managed to download the list of dictionaries for the desired values from the companies. Now we should convert this into a dataframe and change the date data type to string:
# Create a DataFrame from the list of dictionaries
df = pd.DataFrame(data_list)
# Convert the 'Date' column to a string type
df['Date'] = df['Date'].astype(str)
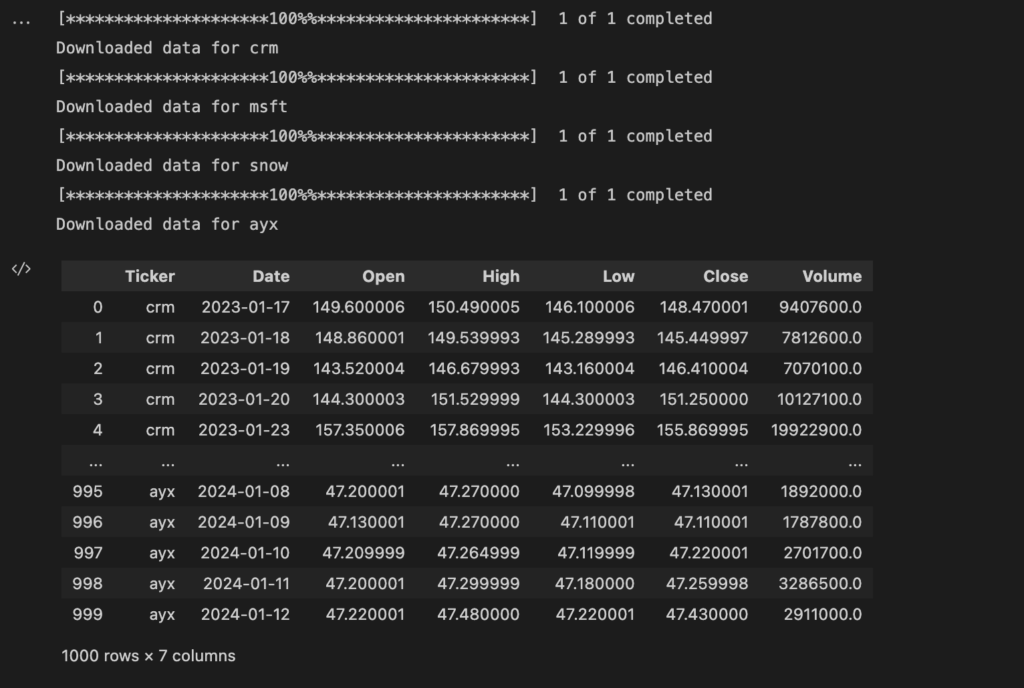
# Print or use the resulting DataFrame as needed
dfOnce we run this code, we should see a dataframe with the stock information of Salesforce, Snowflake, Microsoft, and Alteryx for the past 52 weeks.
Import the Code into Tableau
The next step is to have this code be running live within a data source. To do this, the main tool we are going to use is the table extensions. In essence, table extensions allow us to create data tables with an analytics extension script, in this case, Tabpy. Ensuring again that we have Tabpy running in our terminal and the connection to Tableau Desktop is made, we can go ahead and create a new data source. IMPORTANT: At first, we cannot directly create a table extension without selecting a source. Therefore, in this part, you can select any source file to begin, we will be deleting it anyway afterward. For this, I connect directly to the Global Superstore sample Excel file.
So once we have only the table extension as the connection within the data source, we can copy and paste the code we have written earlier into the table extension. A very important detail to consider here: If we do not convert the dataframe that we created back into a dictionary, the table extension will not be able to interpret the source correctly. We can only have dictionaries here, not other formats, therefore add the code snippet:
return df.to_dict(orient = 'list')
at the end of the code piece. This will convert the dataframe to a dictionary.
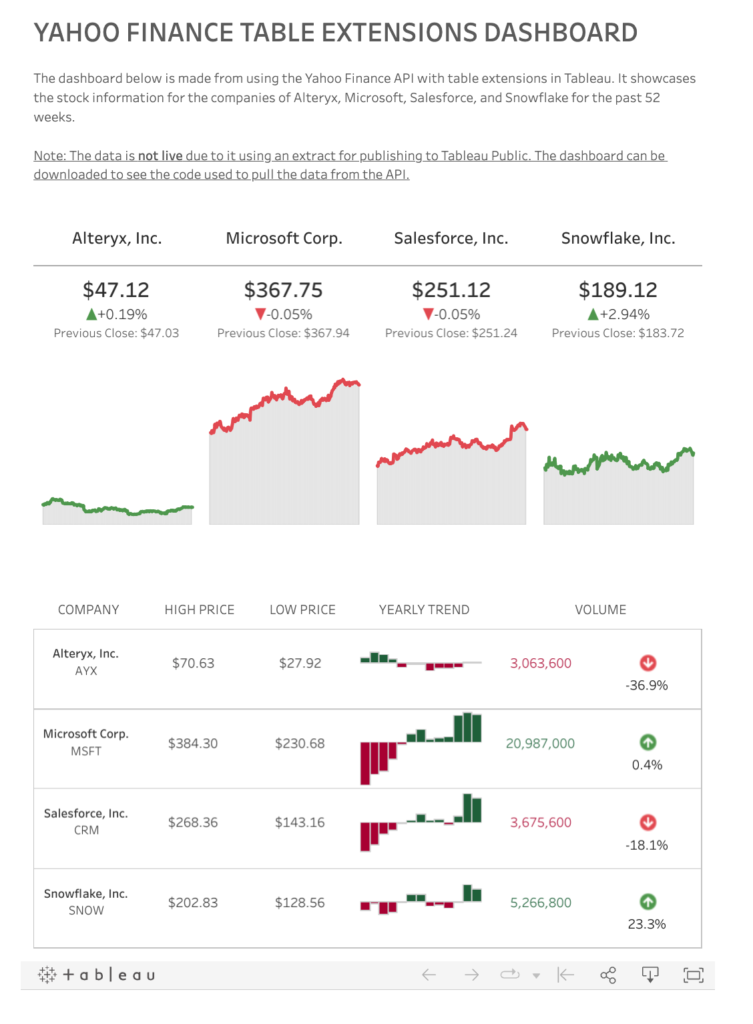
And there we are, the data seems to be pulling through correctly. Now all we need to do is create our visuals. I have taken big inspiration from the Tableau Public dashboard from Maureen Okonkwo for this one. In my version, I created KPIs for the companies, tracking the close value per day, and a table with further information just like Maureen’s dashboard. My Tableau Public visualization can be viewed here and also can be downloaded.
Final Remarks
In conclusion, this guide has explored the integration of Tableau with the Yahoo Finance API, demonstrating a unique approach using Tabpy and table extensions. By leveraging Python alongside Tableau Desktop, we’ve bypassed the need for a database and directly accessed live data from Yahoo Finance. The step-by-step tutorial covered the setup of Tabpy, code composition for data retrieval, and the seamless import of the code into Tableau.
The resulting Tableau Public visualization, inspired by Maureen Okonkwo’s dashboard, showcases KPIs for companies, daily close value tracking, and a comprehensive table of additional information. This methodology not only offers a dynamic way to connect to APIs but also opens up possibilities for interactive and real-time financial data visualizations.
Thank you for reading this blog. Also check out our other blogs page to view more blogs on Power BI, Tableau, Alteryx, and Snowflake here.
Work together with one of our consultants and maximize the effects of your data.
Contact us, and we'll help you right away.