

It has been a little over a month since I attended this year’s Tableau Conference in sunny San Diego. It was my first time experiencing the conference in all...

Recently, I took the PL-300 Power BI Data Analyst exam and I am happy to say that I saw the “Congratulations, you passed” message at the end. Since I...

Stel je voor dat je een verkooprapport in Power BI hebt met gegevens over bestellingen en verschillende verzendmodi, zoals “Standaard levering,” “Express levering,” en “Overnight levering.” Je wilt deze...

Imagine you’re creating a chart and you want to add a certain shape or icon that is not available in Tableau’s default shape palette. For example, what if you...

Less is more. As data analysts we don’t want to see tables with dozens of columns and millions of rows! We just want to see a visual summary. But...
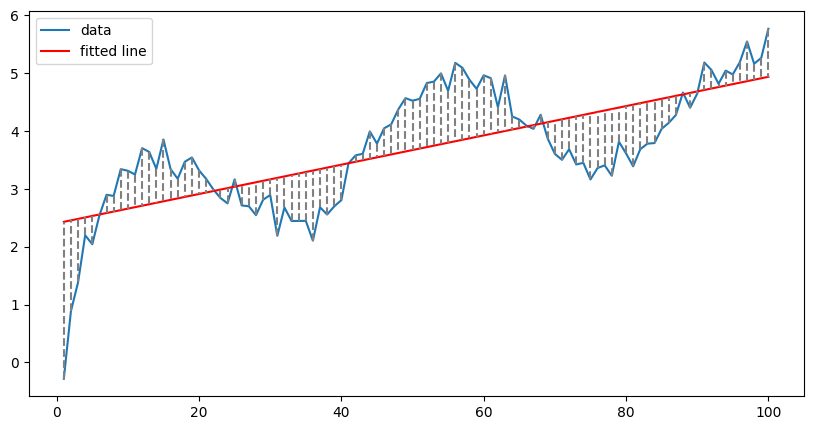
How do you fit non-linear data with a linear model? Using splines is one option. A simple explanation.
Sometimes the end result of your data prepping needs to be a JSON. This can be the case when for instance you need to upload your data to a...

A brief overview of the Snowpark functionality, that allows one to write python code on a Snowflake data warehouse.
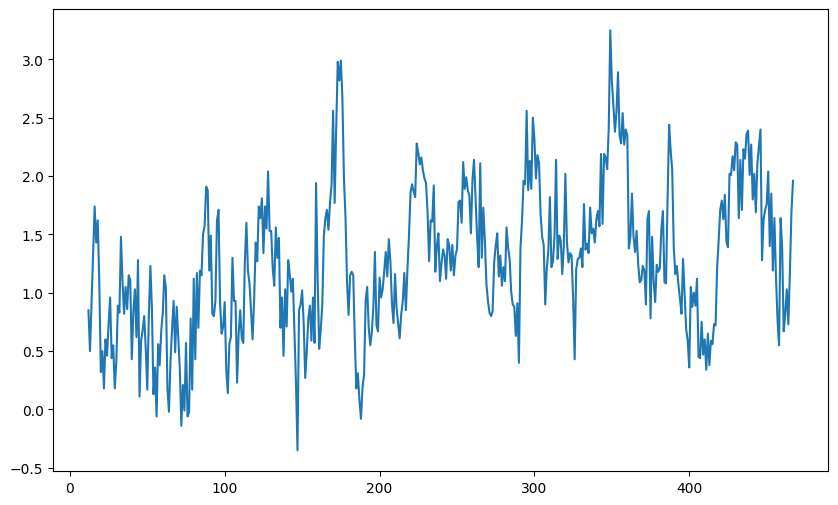
The ARIMA Model In a previous blog post, we delved into the world of time series forecasting with the Holt-Winters (exponential smoothing) model. Today, we will explore another popular...