
As a beginner in Tableau, the first concept I realised that was really important to understand were dimensions vs measures and discrete vs continuous fields. These form the building blocks of any visualisation, which is why this blog will cover its key components and help you understand them.
Dimensions and Measures: What is the Difference?
Think of dimensions as the categorical attributes that provide context to your data. These can include items like dates, names, categories, and geographic locations. On the other hand, measures are the numerical values that you want to analyse or aggregate, such as sales, profits, quantities, or percentages.
In essence, dimensions help you slice and dice your data into meaningful groups, while measures provide the quantitative values you’re interested in exploring.
Discrete vs Continuous Fields
Within dimensions and measures, another important distinction exists: discrete and continuous fields. These type of fields determine how data points are displayed on your visualisations.
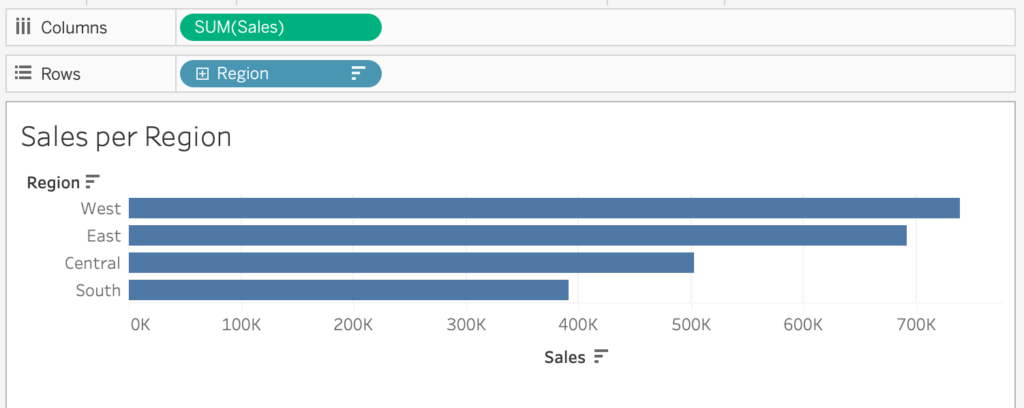
Discrete fields are used for categorical data, such as distinct categories, labels, or groups. When placed on the Columns or Rows shelves in Tableau, discrete fields create separate columns or rows for each unique value.
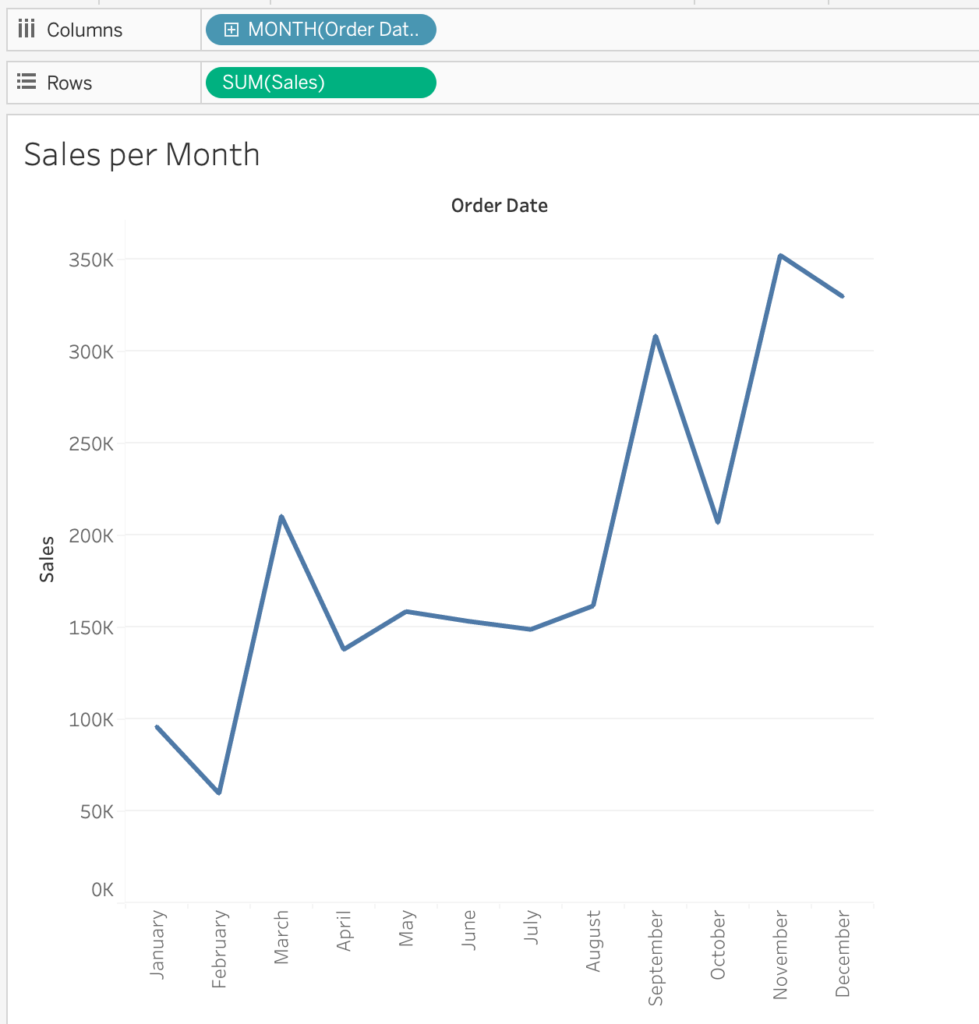
Continuous fields, however, are used for data that can be measured on a continuous scale. This works the best for identifying trends, created using line charts, scatter plots and other visualisations that involve a range of values. Think about wanting to track a trend over a continuous (chronological) period of time for example. When placed on the Columns or Rows shelves, continuous fields create a continuous axis that transitions between values.
How are they combined?
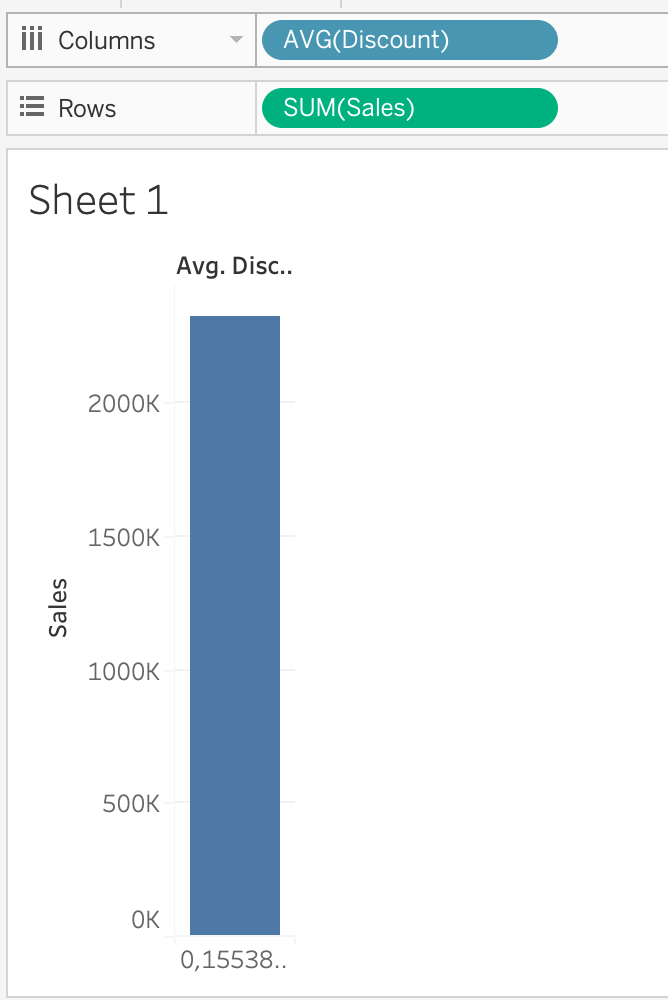
This is where it gets tricky. While dimensions are often used as discrete fields and measures are often used as continuous fields, they are not necessarily the same thing. You can use dimensions as continuous fields in some cases, like creating a smooth line chart of time-series data. Similarly, you can use measures as discrete fields, such as when you want to view the average of a certain measure value.
So, while there is some overlap, the key distinction is that dimensions and measures relate more to the nature of the data itself (context and quantity), while discrete and continuous fields relate more to how the data is treated and displayed in your visualisations.
When working in Tableau, it is important to think about which combination tells the clearest data story and uncovers trends the best. When you click on a field in the data pane in Tableau, you can change the type of a particular field to your liking (dimension, measure, discrete or continuous).
To conclude, mastering dimensions, measures, discrete, and continuous fields in Tableau is pivotal for creating data-driven visualisations that deliver insights at a glance. As I often remember concepts the best through analogies, here’s one for this concept: Think of your data as a musical composition. Dimensions are like different instruments, adding depth and variety to the melody. Measures act as the musical notes, creating the quantitative tune. Discrete fields are similar to individual notes that you can distinctly hear, while continuous fields are the smooth transitions between notes, forming a harmonious piece. By understanding these fundamental concepts, you’ll be well-equipped to transform your data into compelling visualisations.
Want to know more about dimensions and measures, discrete and continuous fields? Check out this video that shows you more examples of how the four concepts are used in Tableau.