
There are multiple ways of combining and relating data sources in Tableau. It is important to understand these methods in order to choose the correct one for accurate and insightful visualisations. This blog will explore four methods: relationships, joins, unions, and blends, to gain a better understanding of their unique characteristics.
Relationships:
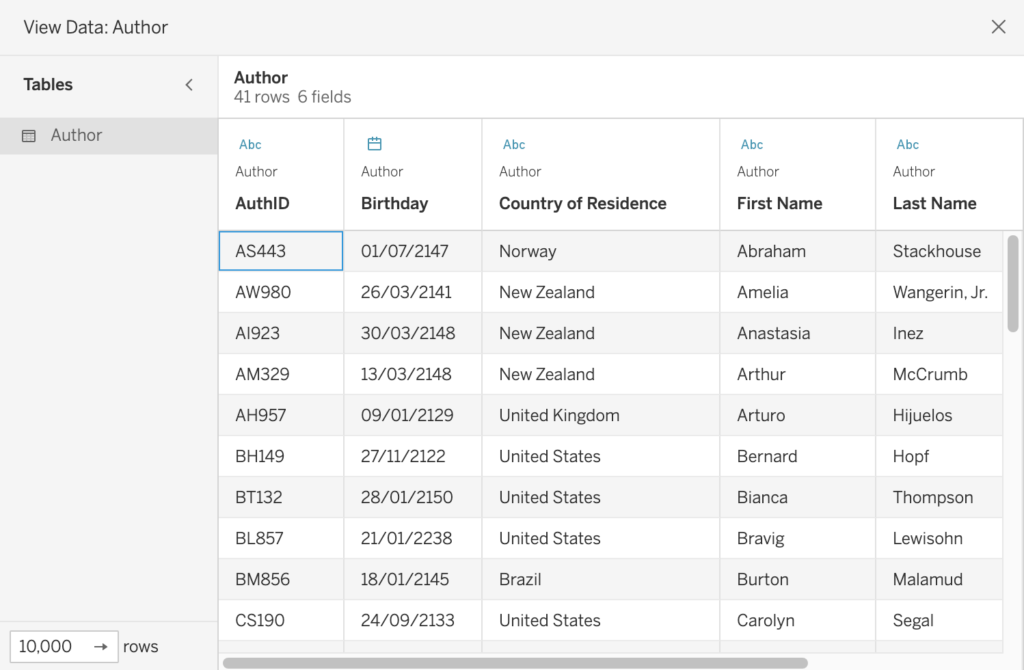
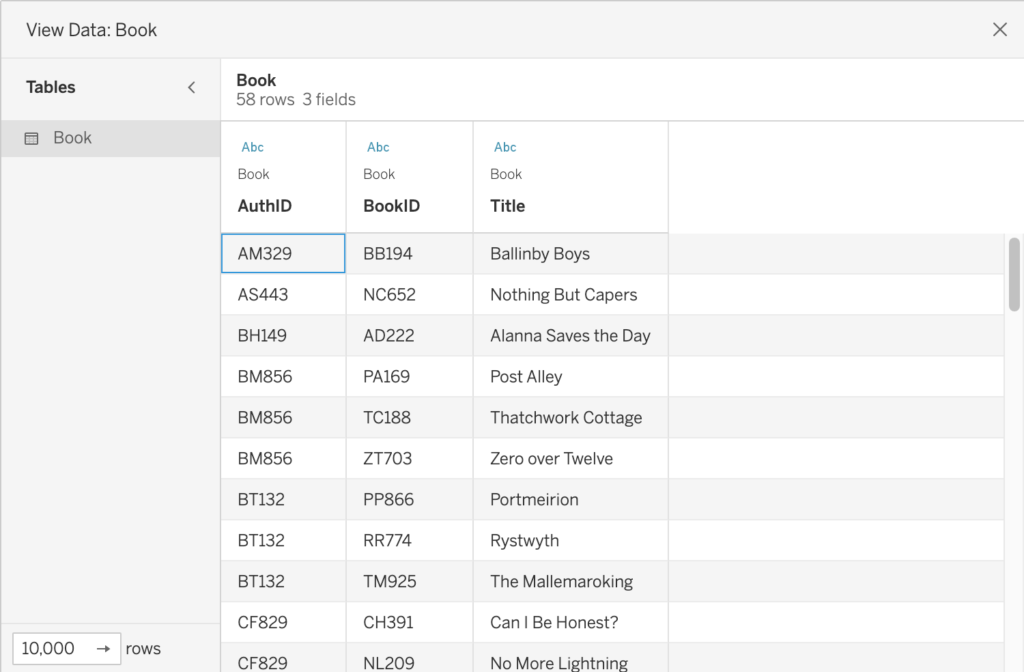
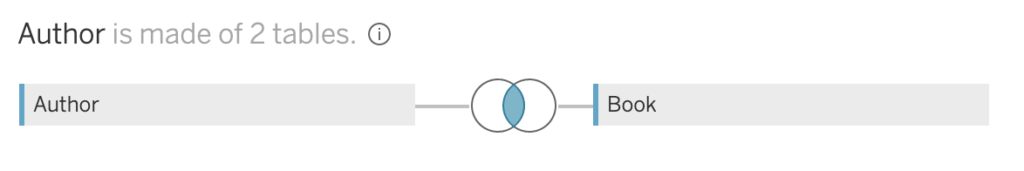
Tableau’s relationship feature allows users to connect multiple tables based on common fields. This method is particularly useful when dealing with data from different sources or databases. By establishing relationships between tables, you can prevent unnecessary data duplication, ensuring a more efficient and manageable workbook.
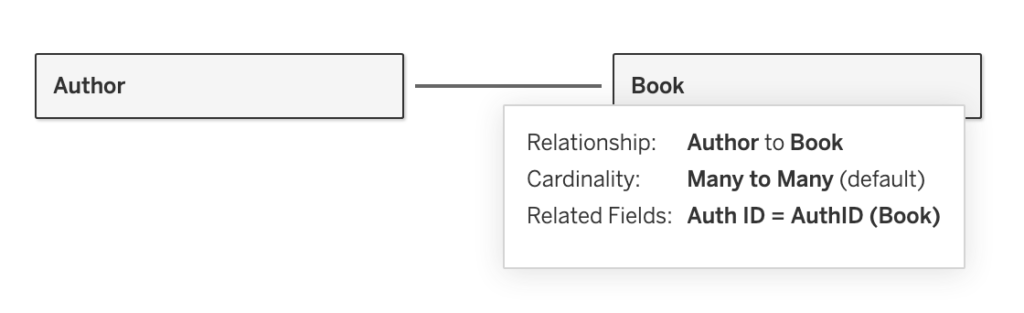
Relationships are highly flexible, enabling you to combine tables with different levels of granularity, making it ideal for data with varied details and resolutions.
Joins:
Joins are a common operation in databases and data analysis, and Tableau supports various types of joins. When using joins, multiple tables are combined horizontally into a single, unified dataset based on a common field. Unlike relationships, joins merge tables into one large table, meaning they lose their independence. This method is particularly useful when dealing with data that shares a primary key-foreign key relationship.
Joins can be powerful, but they can also lead to data duplication and complexity, especially when dealing with large datasets. Additionally, joins can sometimes lead to data loss if there are missing values or inconsistencies in the data.
Unions:
Unions allow you to combine data from similar tables or datasets vertically, effectively lengthening the data (whereas Joins combine data horizontally – widening the data). This method is helpful when dealing with data that has the same structure but is split across multiple files or tables. For example, if you have quarterly sales data in separate tables, you can use a union to combine all the tables into one dataset.
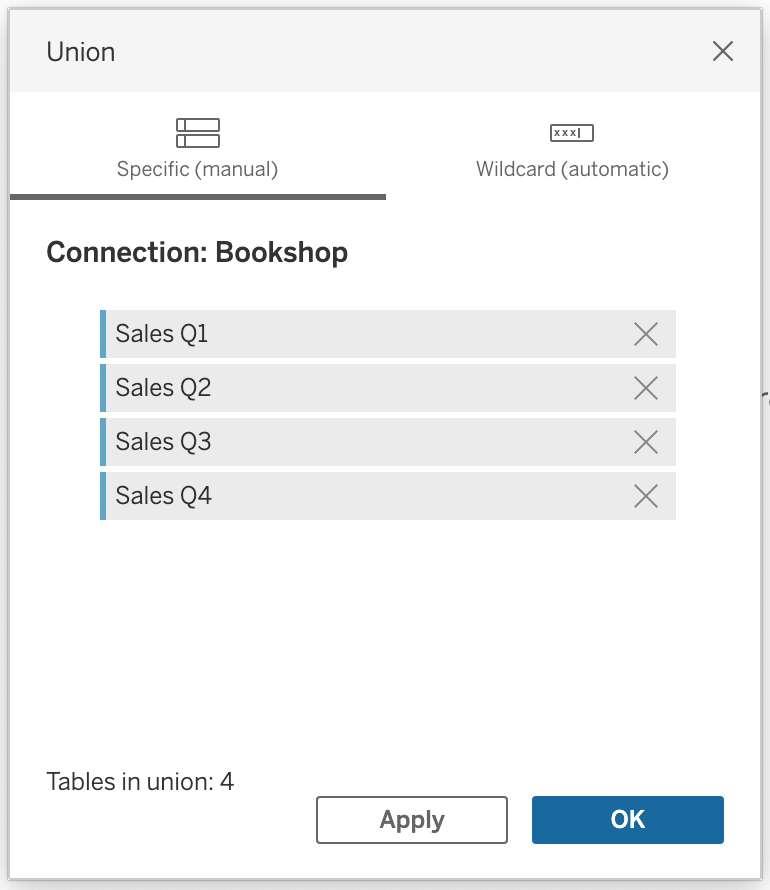
It is essential to note that unions are only possible when the tables have nearly identical columns and similar levels of aggregation.
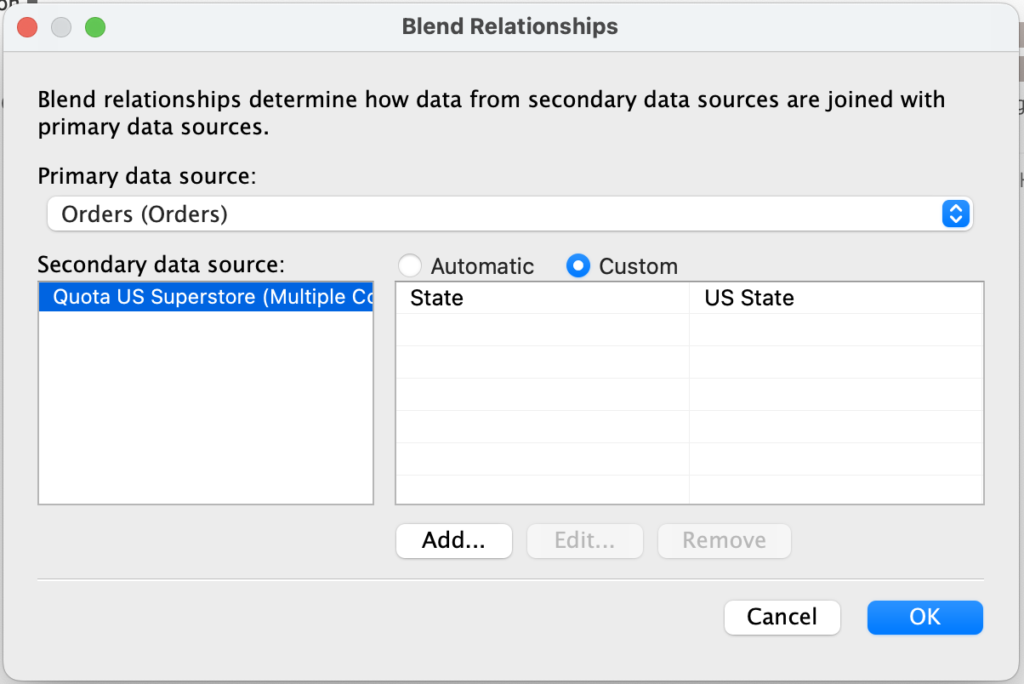
Blends:
Data blending is another data-widening method in Tableau, which establishes a link between specific fields from a primary data source and an aggregated secondary data source. It allows users to connect and compare data from separate data sources based on common dimensions.
Data blending is well-equipped to handle different levels of granularity, as the data remains separate in the data sources, and Tableau performs aggregation and calculations across the blended data. However, blending may not provide the same level of performance as using relationships or joins and can be less efficient in certain scenarios.
Understanding the differences between relationships, joins, unions, and blends in Tableau is fundamental for making informed data analysis decisions. Each method offers unique advantages and is suitable for specific data scenarios.
Do you want to gain a deeper understanding of blends, unions and joins? Click on this link to watch an informative session on the differences between each method, as well as when and how to use them. Happy visualising!