
Introduction
The Dynamic Zone Visibility feature in Tableau has been around for almost a year from today and there are a lot of different use cases on how they can be used in dashboards. As a quick refresher, the Dynamic Zone Visibility feature allows you to show/hide objects that are on a dashboard dynamically based on a field or parameter. These can be sheets, objects, or whole containers with multiple elements. However, the rule is that for this feature to work, the field or parameter we base the thing and showing must either be a boolean or a single value. Visit this link if you want a deeper refresher on the topic.
Focus on One Sheet at a Time
As for now in this blog, I will be sharing one of the many things we can do with Dynamic Zone Visibility. Which is to configure a focus/zoom feature per sheet on a dashboard using dashboard actions and dynamic zone visibility of course. Check out the video below to see what I mean:
Suppose you have a number of sheets in a dashboard and you want to focus on one of them once you click their header to see the variations in the data a little more clearly. This feature can help you achieve that.
What is going on in the background is that once I click the header, I am telling Tableau to hide the other two sheets, resulting in the clicked sheet being expanded to the whole view. Once I clear the selection, all the sheets display again.
Configuring this feature, we need to keep a few things in mind:
- Dynamic Zone Visibility
- Parameter
- Boolean Calculations for filtering
- Containers
- Parameter Action
- Custom String Fields
Let me now show you step by step how I configured this:
Step-by-Step on How to Configure
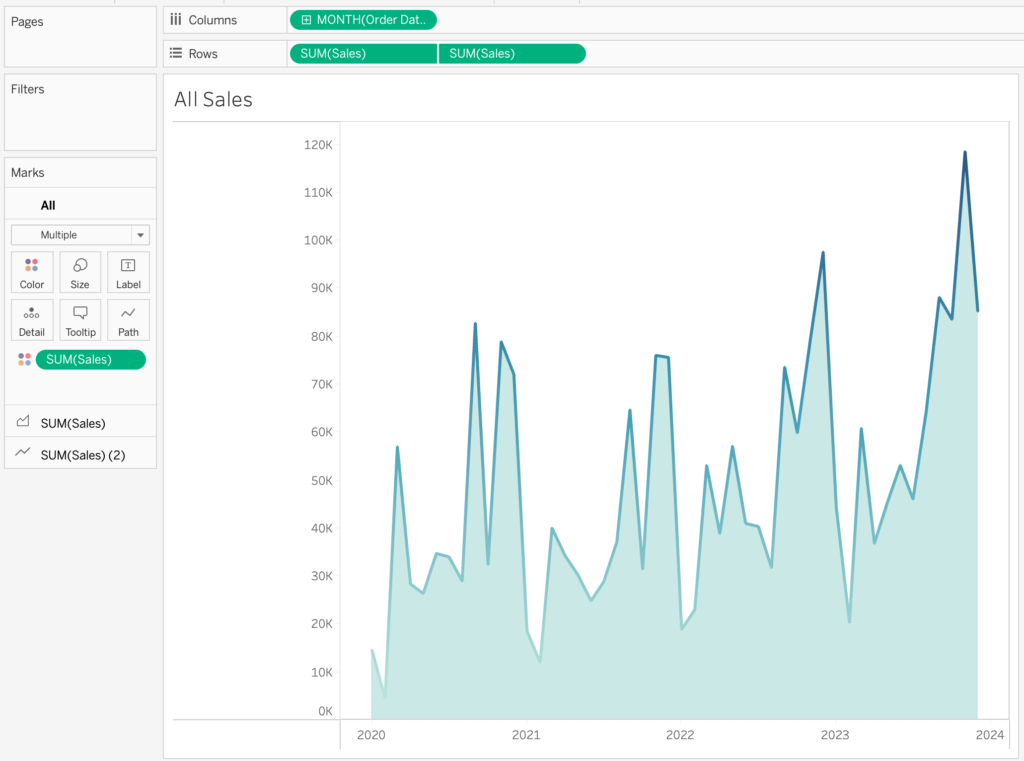
In my example above, I am using the Sample – Superstore Data source in which I created three sheets from:
Configure Your Sheets
On the top sheet, I am showing SUM(Sales) by month of Order Date. The middle one is the same but also with the [Category] dimension in the Rows. And the one at the bottom is the same as well but for [Segment] instead of [Category]. So first things first is to configure the sheets that you want to use.
There will be an extra addition that we will make to each sheet so that they can be used with the dashboard actions. I will get to this a little later.
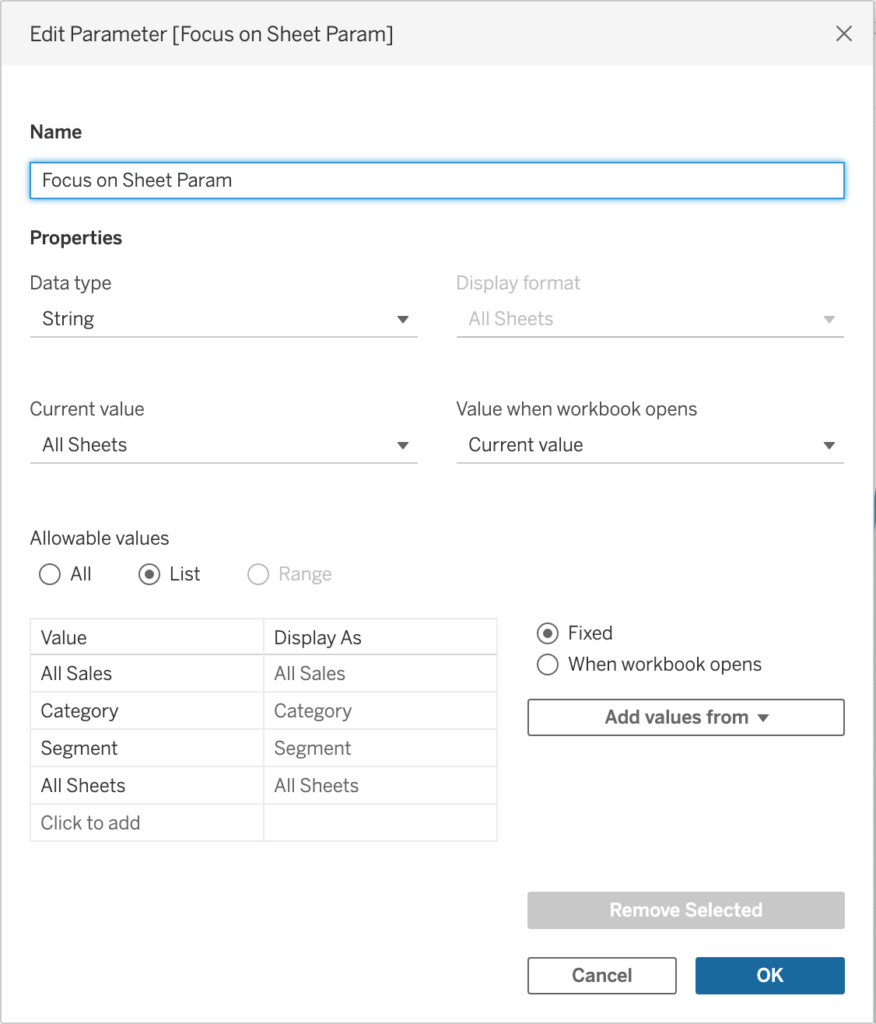
Set up your Parameter
After configuring the sheets, it is time to set up your parameter. I have three sheets, one shows all sales, one with category, and one with segment. I also want to be able to view all at once as well. So my parameter values should represent what I want to see:
Make the Calculations
The next step is to configure some calculations, three to be exact in my case. What the calculations should output is TRUE or FALSE. They are the key element to show or hide. Here are the calculations I write for each sheet:
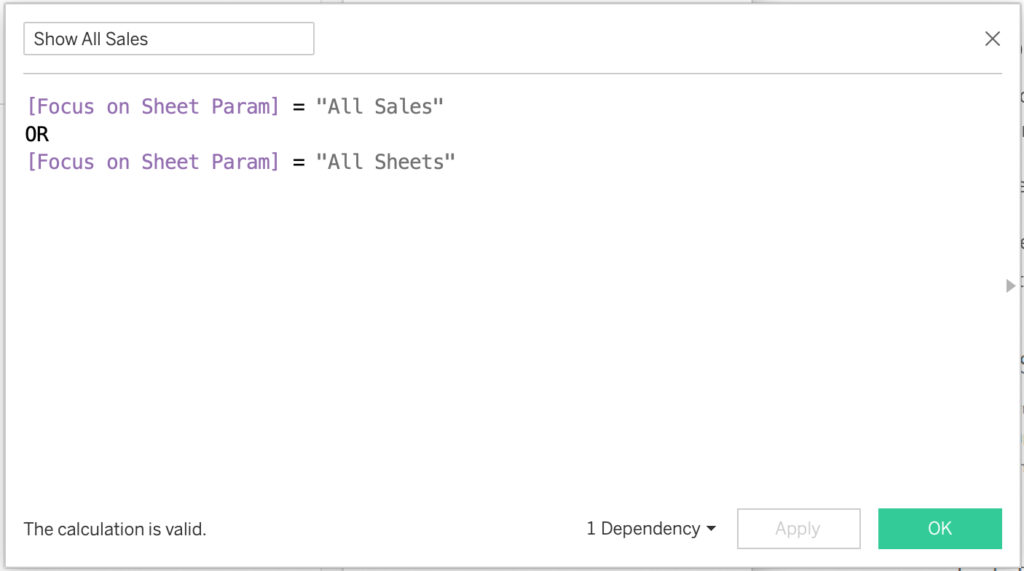
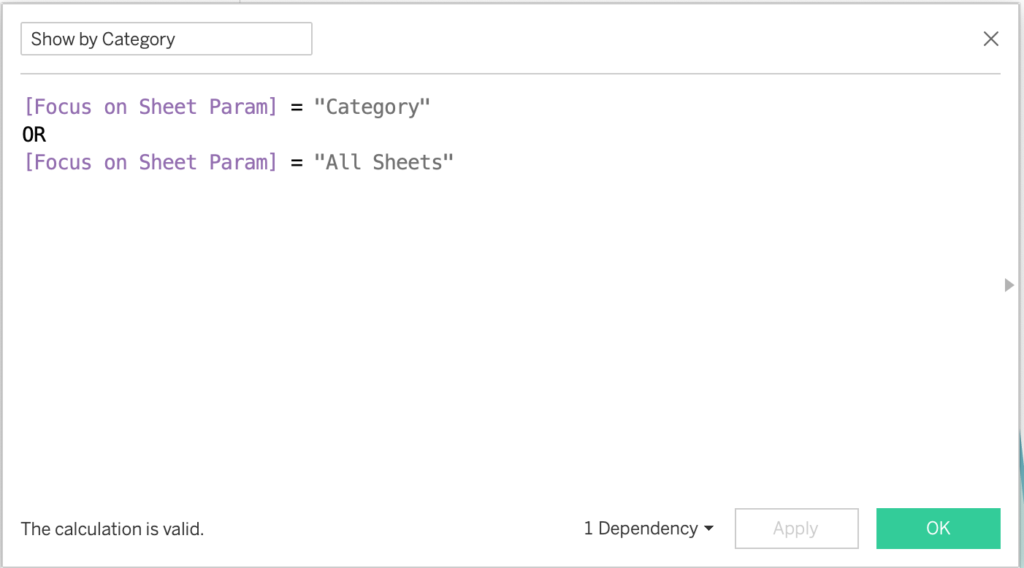
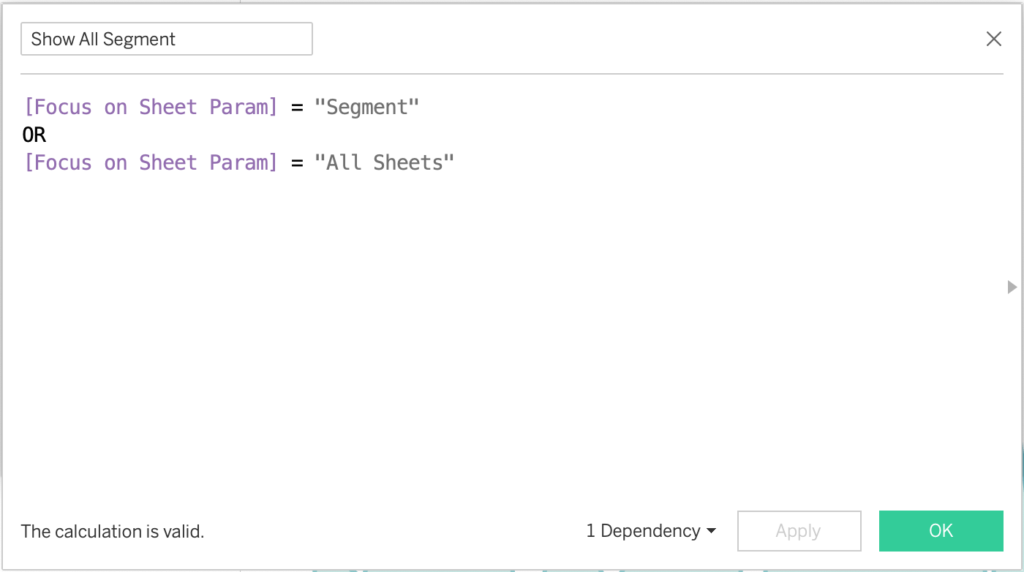
You do not have to place these new calculations anywhere in the sheets, they will be used separately. Since I want to see all as well when no individual selection is made, the “All Sheets” parameter member is also a condition on all the calculations.
Make the Dashboard and Configure Dynamic Zone Visibility
The next step entails putting together the sheets in the dashboard. Make sure you place all these sheets in the same container, or else it will not work. In my case, I placed all the sheets in a Vertical Container.
Next up, for each sheet, configure the Dynamic Zone Visibility from the “Control visibility using value” checkbox under “Layout”. Do this for each sheet with their appropriate calculation.
To test if the functionality works in the first place, you can bring out the parameter and cycle through it to see if everything is working as expected.
Bring out the Dashboard Action
After we configured all the functionalities so far, it is time to do the last step, which is to change parameter values with dashboard actions rather than cycling through the parameter itself as shown in the video above.
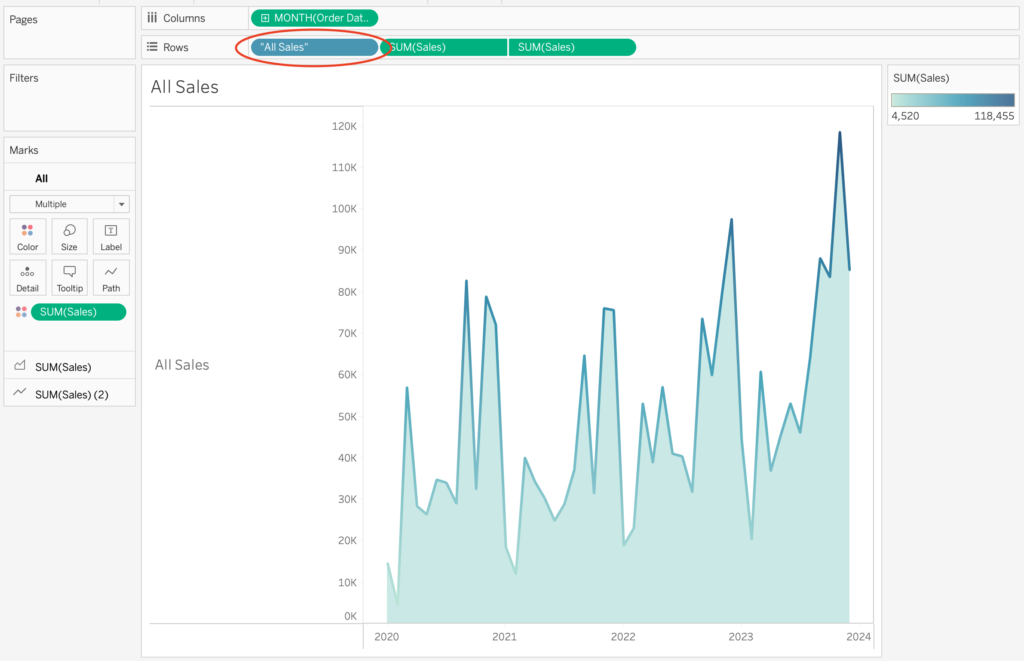
Before we set the actions, we need to add something to the sheets. We need to create a custom field that equals the name of the parameter member each sheet is concerned with. For example for all sales, I created a custom field with just the string “All Sales” and placed it as a row. We need this since we are trying to equalize the object we click on in the sheet to the parameter names.
In the other sheets, I configure them as well, but I have unchecked “Show Header” therefore it does not display. Here is the category one as another example:
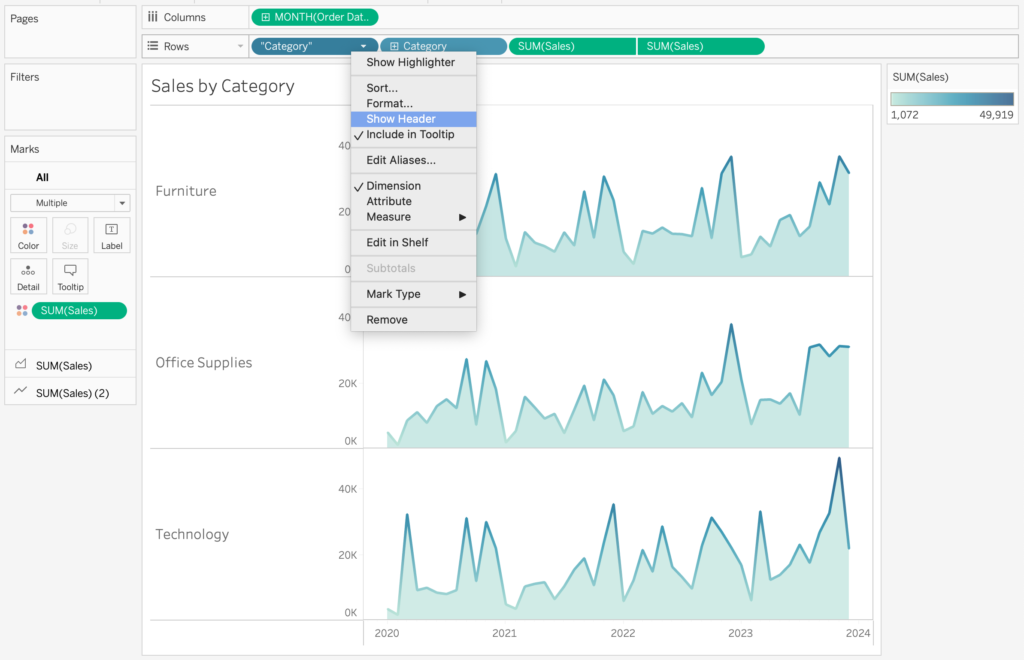
After we do this for all three (make sure the string is the same as the parameter names in question) now we are ready to configure the parameter action.
Just like the calculations, we will configure three parameter actions, one for each sheet: Here is the configuration for all:
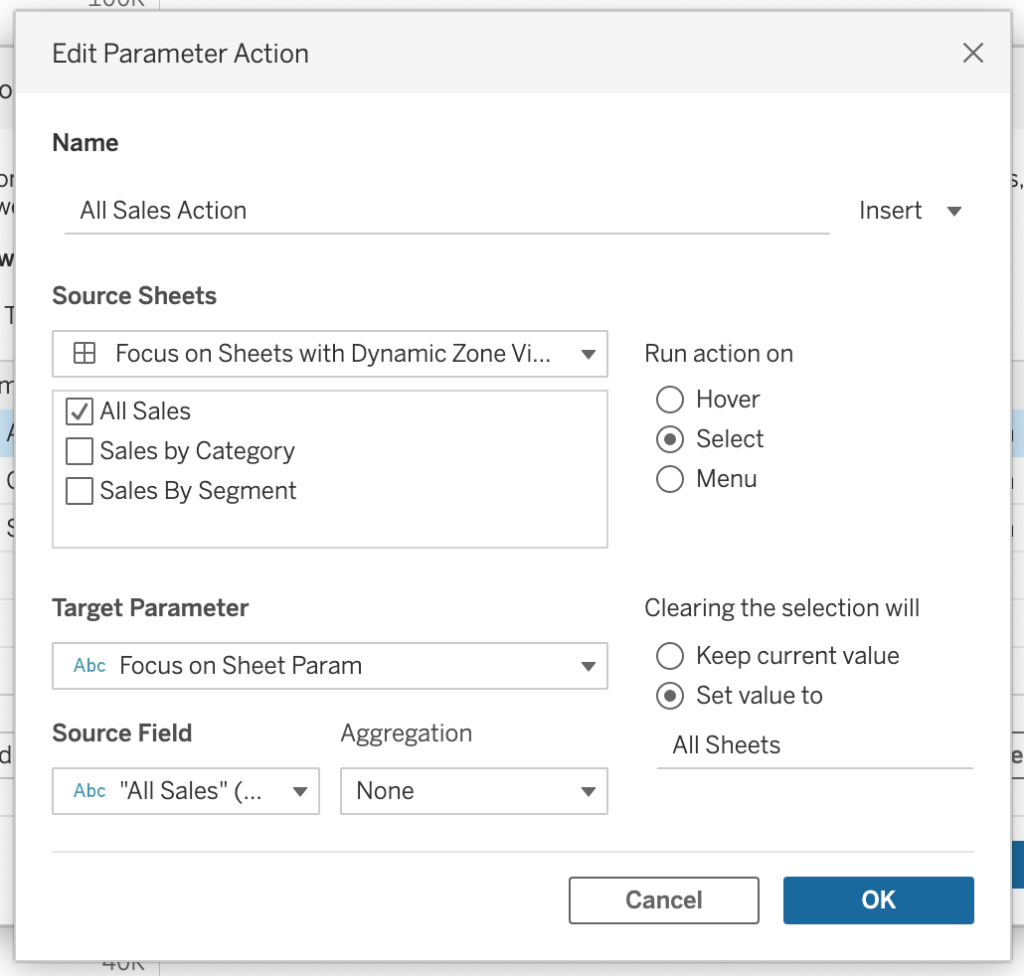
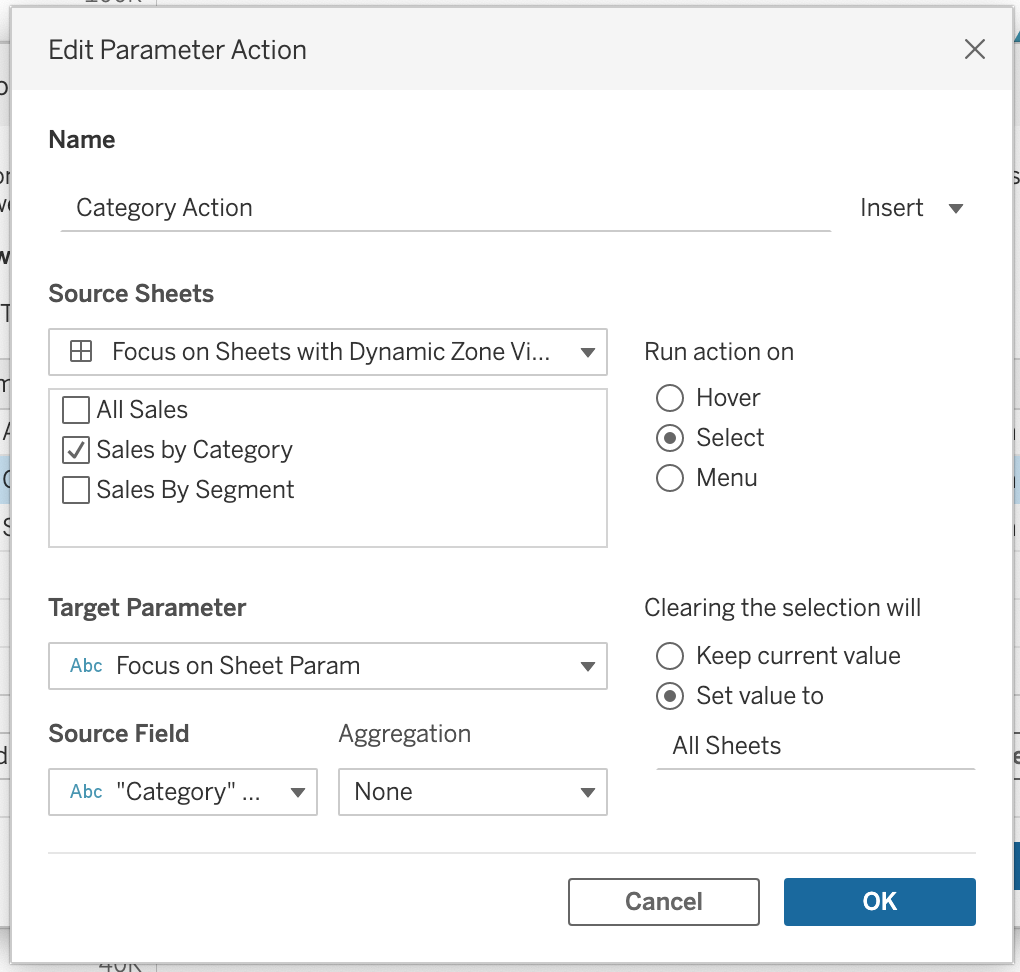
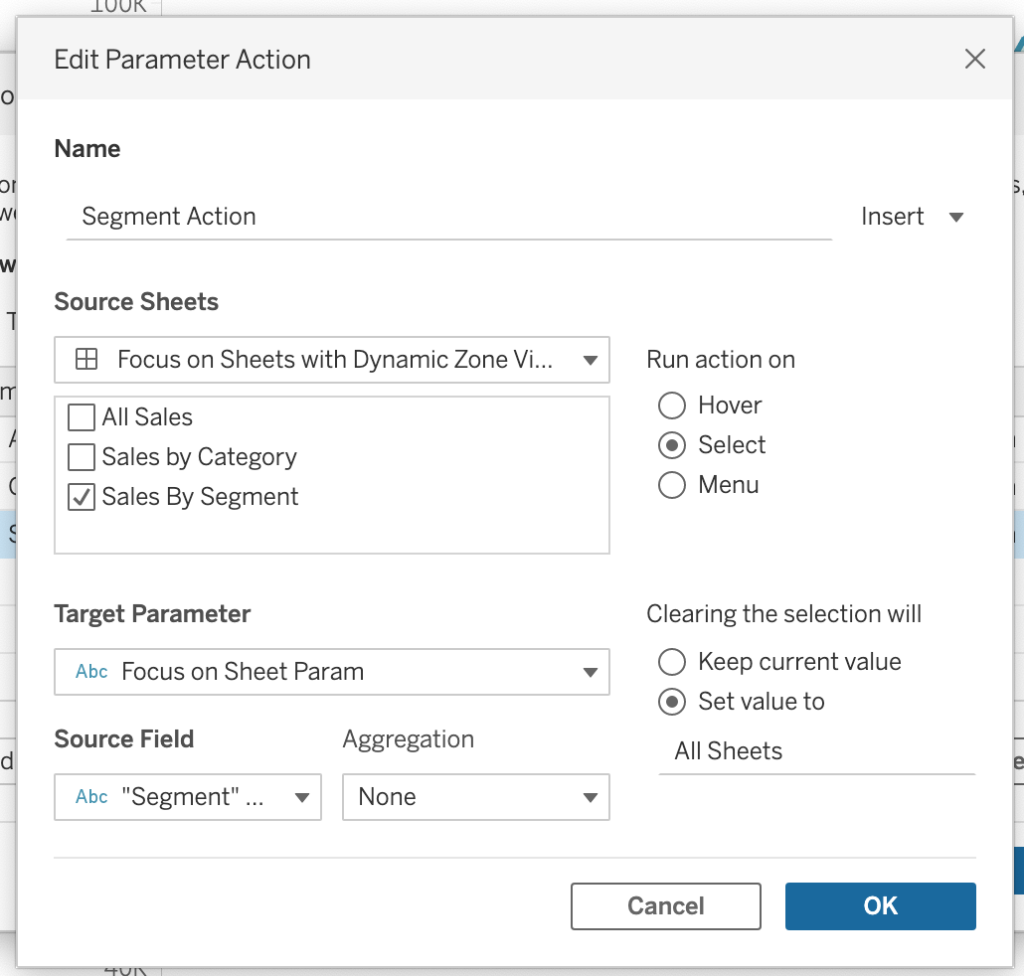
The important thing to pay attention to is for each of the three actions, select one source sheet. Target the parameter we created. Select the custom field we make for each of the sheets as the source field. And when clearing the selection, set the value to “All Sheets”, which makes sure that we see everything again.
Final Remarks
And there you are, you have configured the focusing technique using Dynamic Zone Visibility and Parameter Actions. This is particularly useful for the user to be able to see a bit more detail in terms of the fluctuations in the data.
Thank you for reading this blog. Also check out our other blogs page to view more blogs on Tableau, Alteryx, and Snowflake here.
Work together with one of our consultants and maximize the effects of your data.
Contact us, and we’ll help you right away.