
Have you ever had the need to create a KPI that represents the # of *dimension* that represents the X% of a *measure*. For example:
- Number of customers that represents the 80% of sales
- Number of products that represent 50% of profit
- Number of countries that represent 90% of the quantity of products sold
This happened to a coworker of mine and thanks to our collective input we managed to get to a solution. In this blog, I will show you how to hack your way through Tableau to achieve this.
Let’s start creating our KPI!
Let’s take Sample Superstore and let’s try to answer: what is the number of customers that represents 80% of sales?
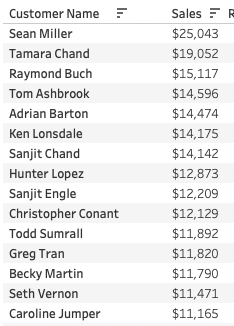
Just to visualise, let’s start by seeing a descending list of all the customers with their respective sales
First, we will like to know what percentage the customers represent from the total sales. For that, we will do the following:
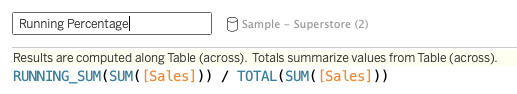
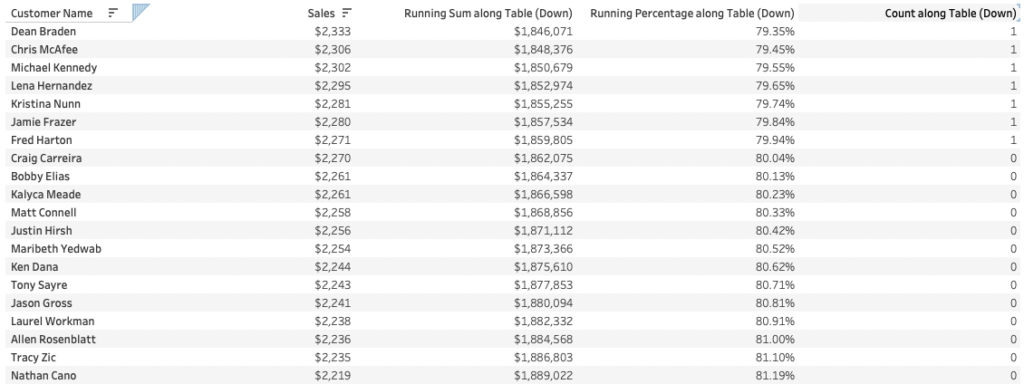
If you do a running sum of the sales per customer and divide it by the total amount of sales you will have a list of customers and how much their sales represent (%) from the total amount of sales.
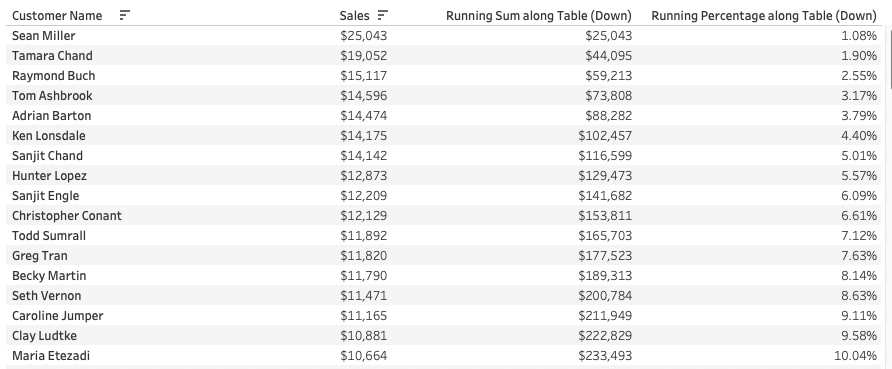
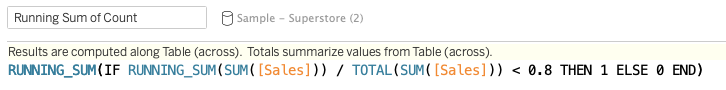
Now we will want to count how many of these customers represent our 80%:
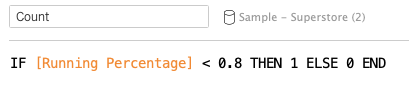
Your [Count] list will have a list of 1’s until your [Running Percentage] surpasses 80%.
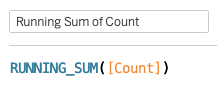
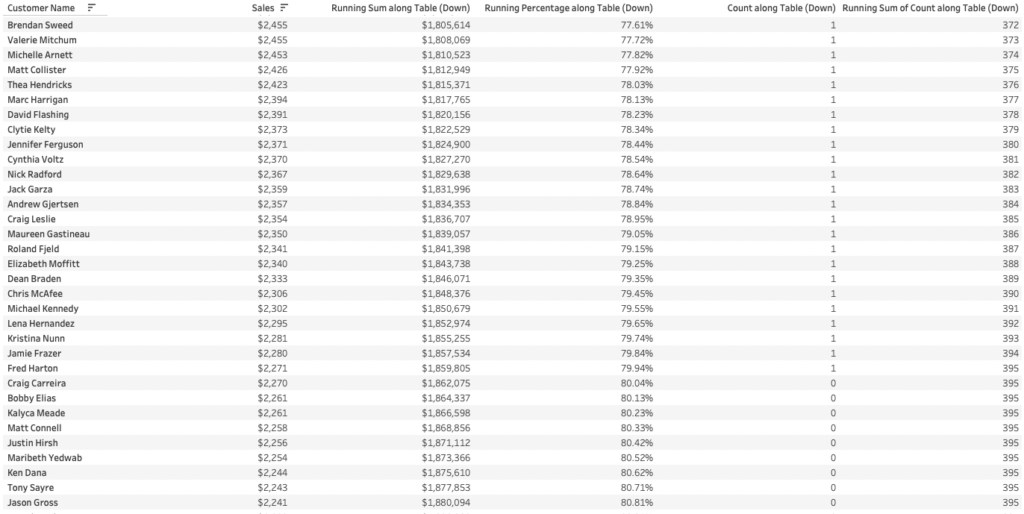
Now what you have to do is do a running sum of this count and you will have (by the end of the list) the number you have been looking for.
In this case 395 customers
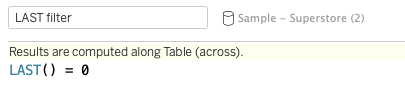
To convert this number to a KPI you will need to remove all of your measures but the last one, [Running Sum of Count]. You will also create a [LAST filter].
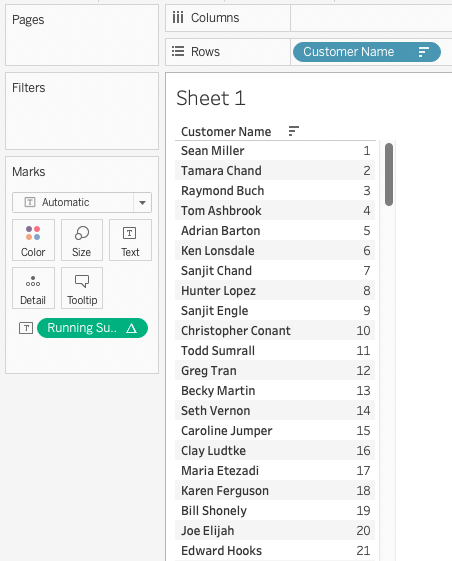
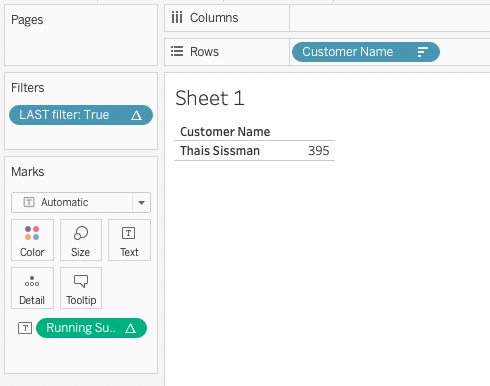
Add this (True) [LAST filter] to the view and you will have a first glance of your KPI
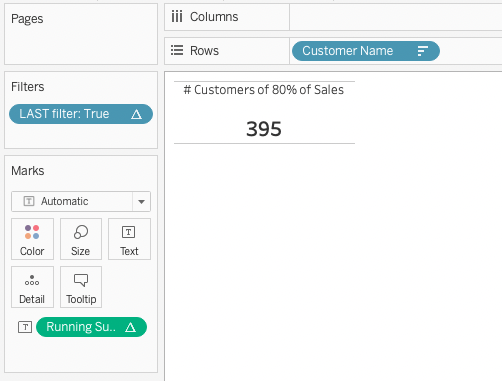
Right-click on [Customer Name] to remove the tick of ‘Show Header’. Change or hide your title and format your view to get the KPI that you need.
TL;DR
Now you have all the tools necessary to create the KPI that you need if you follow the same principle adding your custom measures/dimensions!
For this and more tips visit our website: https://theinformationlab.nl/en/blogs/