
In today’s fast-paced business environment, data is a critical asset that can make or break an organization’s success. To get the most value out of data, companies need to ensure they are measuring the right metrics accurately and consistently. This is where dbt (data build tool) comes in as a popular data transformation and modeling tool.
By using dbt, businesses can easily define and calculate metrics that are essential to their operations. Metrics like revenue, user engagement, customer churn, and product adoption are some examples that businesses track to understand their performance. By using dbt, these metrics can be reliably and consistently tracked over time, enabling organizations to make data-driven decisions.
In this blog, we will dive deeper into dbt metrics to see how they can be defined and calculated. So, let’s get started and explore how dbt can help you better measure and understand your business performance.
Benefits of using dbt to manage metrics
There are several benefits of using dbt to manage metrics in your data pipeline:
- Consistency: dbt ensures that metrics are defined and calculated consistently across your organization. This consistency ensures that everyone in your organization is using the same data and metrics to make decisions, leading to more effective decision-making.
- Scalability: As your business grows, you will likely need to track more metrics. dbt’s modular approach makes it easy to add new metrics as needed without disrupting existing ones. This scalability ensures that you can continue to track and measure the metrics that matter as your business grows. In the case of dbt Cloud, defined Metrics can be referenced from external tools via the Semantic Layer.
- Flexibility: With dbt, you can define metrics based on your specific business needs. This flexibility means that you can define metrics that are relevant to your business, rather than relying on pre-defined metrics that may not capture what matters most to your organization.
- Automation: dbt automates the process of calculating and updating metrics, saving your team time and reducing the risk of errors. This automation ensures that metrics are up-to-date and accurate, enabling your team to make data-driven decisions with confidence.
- Transparency: dbt makes it easy to understand how metrics are defined and calculated. This transparency ensures that everyone in your organization can understand how metrics are calculated, increasing trust in the data and promoting data literacy across your organization.
Preparation
Please check the official repository of dbt Labs ‘jaffle_shop_metrics’ and fork this repository using your GitHub account in advance so that it can be referenced from dbt Cloud.
I assume you have a dbt account. if you don’t have one, then you must check it out!
I will also use Snowflake account, and if you don’t have one, feel free to make a free Snowflake trial account.
Now, let’s create a new dbt project using the remote repository we have just forked and connect it to a Snowflake account.
Environment Checks
In order to check whether the objects on Snowflake can be operated correctly from dbt, we’ll do the next steps:
- Create a branch via dbt cloud
- Run
dbt deps(For managing external packages and dependencies between models)
Packages included in the repo:packages:- package: dbt-labs/metrics
version: [">=1.4.0-a1","<1.5.0"]- package: dbt-labs/dbt_utils
version: 1.0.0 - Execute
dbt seedanddbt runto check whether the schema and table are created in the target DWH.- Important notes:
example_develop_metrichas an error. It is an example for writing a query using metrics. We will ignore it by deleting the model or by adding a ‘disable config’ in the model:{{config(enabled = false)}}
- Important notes:
Data Lineage
Let’s have a look at the way data is structured in our pipeline, checking dependencies and derived matrices. Check out the different intermediate models to understand the underlying data and how it was joined together.
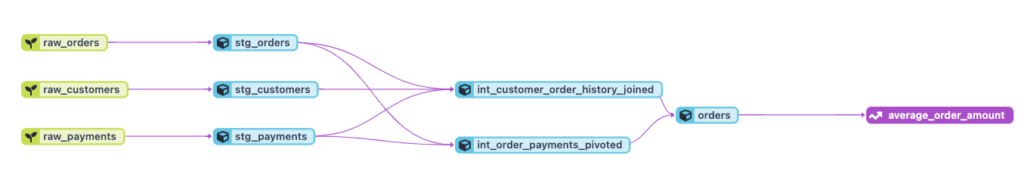
Metrics Definition
Let’s have a look at /models/marts/average_order_amount.yml. It is a metric defined to display the average order value by day, week, and month for each granularity such as customer status.
Note: The attribute dimensions in /models/marts/average_order_amount.yml (Metric yaml file) needs to be corrected. It has a few fields starting with ‘has’, but actually the field in orders model starts with ‘had’.
version: 2

metrics:
  - name: average_order_amount
    label: Average Order Amount
    model: ref('orders')
    description: "The average size of a jaffle order"

    calculation_method: average
    expression: amount

    timestamp: order_date
    time_grains: [day, week, month]

    dimensions:
      - had_credit_card_payment
      - had_coupon_payment
      - had_bank_transfer_payment
      - had_gift_card_payment
      - customer_status
A few mandatory and optional attributes had been taken into account such as:
nameA unique string used to refer to the target Metrics.modelThe model name referenced by the target Metrics (ref('<name_of_model>'))labelAn arbitrary string to express metric more clearlycalculation_methodSpecifies the calculation method of the metric. More optional methods are available.time_grainsThe time-based component of the metrictime_grainsUses the field specified bytimestampto specify the granularity of aggregation, such as day, week, month etc.dimensionsA list of fields to group or filter the metric by
You can read and check all about available properties in the official docs.
Metric Filters
revenue is yet another metric that calculates the total sales for the jaffle shop business. Another attribute has been added here: filters.
version: 2

metrics:
  - name: revenue
    label: Revenue
    model: ref('orders')
    description: "The total revenue of our jaffle business"

    calculation_method: sum
    expression: amount

    timestamp: order_date
    time_grains: [day, week, month, year]

    dimensions:
      - customer_status
      - had_credit_card_payment
      - had_coupon_payment
      - had_bank_transfer_payment
      - had_gift_card_payment

    filters:
      - field: status
        operator: '='
        value: "'completed'"
filters is a list of dictionaries to extra define the metric based on specific conditions. All three properties (field, operator and value) are required for each defined filter. When calculating revenue we sum up amounts for completed orders.
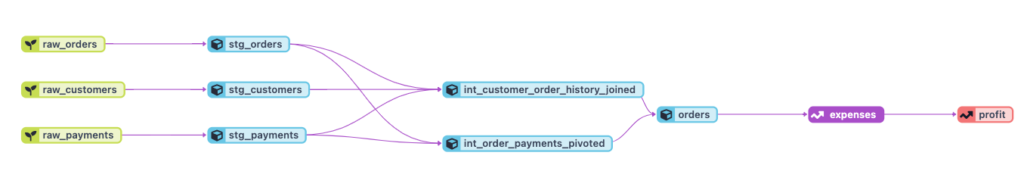
Another kind of metric calculation_method that can be used is derived. It is a calculation based on using 2 or more already defined metrics. We can see a derived calculation in the profit yaml file using the expression: "{{metric('revenue')}} - {{metric('expenses')}}" – (check out profit.yml). Note that derived metrics used in the expression share the specified time_grains and dimensions.
Querying Your Metric
After defining the metrics we would also like to use them :). To query your defined metric, you must have the dbt_metrics package installed.
- Define the metric being called:
metric('<metric_name>') - Provide the grain that we are interested in:
grain = '<time_grain>'
(e.g. ‘day’, ‘week’ or ‘month’) - Provide the list of dimensions we want to see finer granularity:
dimensions = [<dimension1_name>,<dimension2_name>]
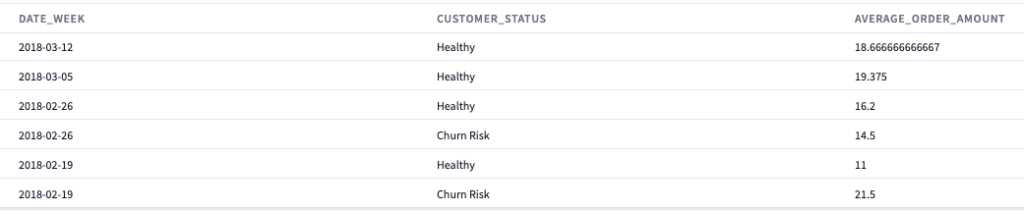
select *
from {{ metrics.calculate(
    metric('average_order_amount'),
    grain='week',
    dimensions=['customer_status'],
    secondary_calculations=[],  -- Optional
    where = "<some_column> = '<filter_value>'"  -- Optional
    ) }}
Secondary calculations refer to additional calculations or transformations performed on top of the base metrics to derive more complex or nuanced metrics.
In cases where we want to see a metric in the context of a particular filter which isn’t necessarily part of the metric definition, we can use a where clause. It takes a list of sql statements and adds them in as filters to the final CTE in the produced SQL.
Summary and Prospects
In dbt, metrics are defined as pre-defined calculations that are based on one or more columns in a table. These metrics can be used to measure different aspects of the data and are commonly used to track performance, monitor KPIs (Key Performance Indicators), and derive insights.
The dbt Semantic Layer can leverage metrics to provide a consistent and standardized way of measuring and analyzing data. By defining metrics in the Semantic Layer, organizations can ensure that all users are using the same calculations, definitions, and business rules.