Improving the performance of dashboards is one of the most sought-after areas when working with Tableau. Even though the reasons why performance might be degraded can come from a hundred different reasons, the tools to help you solve these issues are supplied by Tableau. Which is the performance recorder. And more recently, the workbook optimizer.
In this blog, I will describe both of the tools and show their similarities and differences in a comparison table.
Performance Recording
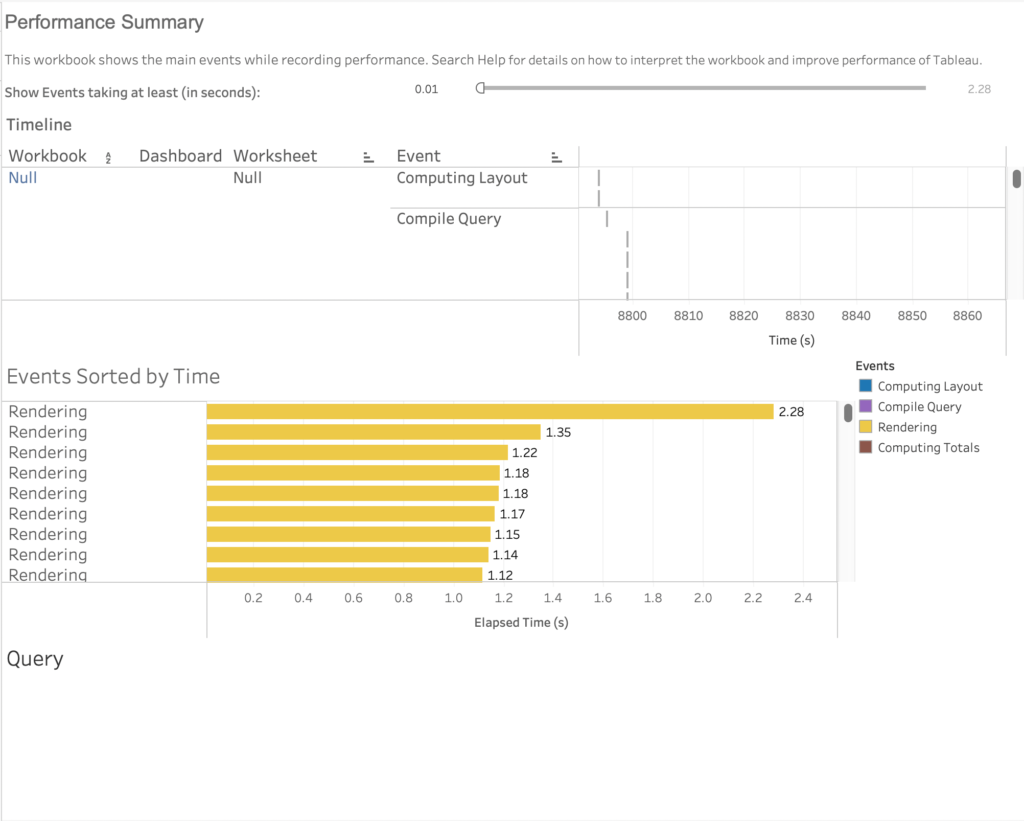
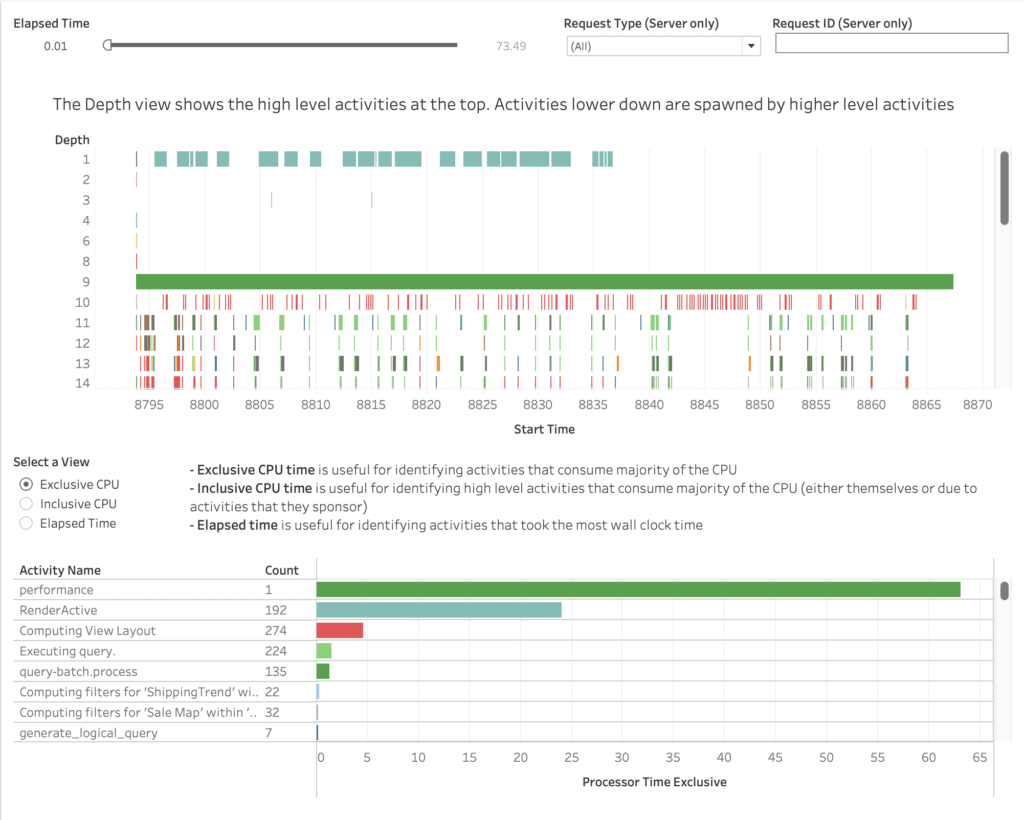
The performance recording feature in Tableau allows you to display the performance metrics of your workbook in two separate generated dashboards. In these dashboards, Tableau analyses different events that are known to affect performance the most and gives a detailed overview of the amount of time they took. The events in question are:
- Query execution
- Compiling query
- Geocoding
- Connections to data sources
- Layout computations
- Extract generation
- Blending data
- Server Rendering
In order for the workbook to generate, you will need to interact with the different elements in your dashboard in question.
The two main generated dashboards are created under the following names. Which are the “Performance Summary” and “Detailed Views”. The Performance Summary dashboard is going to contain a higher-level overview of elements in the dashboard that took the longest time to execute. The Detailed Views go much more into technical detail.


The Performance Recorder’s benefit is allowing the user to see exactly what events are causing the longer loading times. The recording configuration varies if you are on the desktop version of Tableau or the Server. To get more precise steps to configure the performance recording. Check out this link first. For detailed explanations on how to interpret the generated views, check out this link.
Even though the performance recorder can provide very insightful information on where the performance problems are coming from in your dashboards, there is no information provided on how to fix these issues. This is where the Workbook Optimizer can offer some help.
Workbook Optimizer
The Workbook Optimizer is relatively a newer tool in Tableau (2022.1). It is designed to check your workbook to see which performance best practices are being followed and what are not. The end result is a pop-up window with performance best practice details. However, the guidelines are limited in the case that not all recommendations can be applicable or even appropriate. Some aspects of performance degrading conditions are not captured as well. However, it will still offer some easy wins on performance.
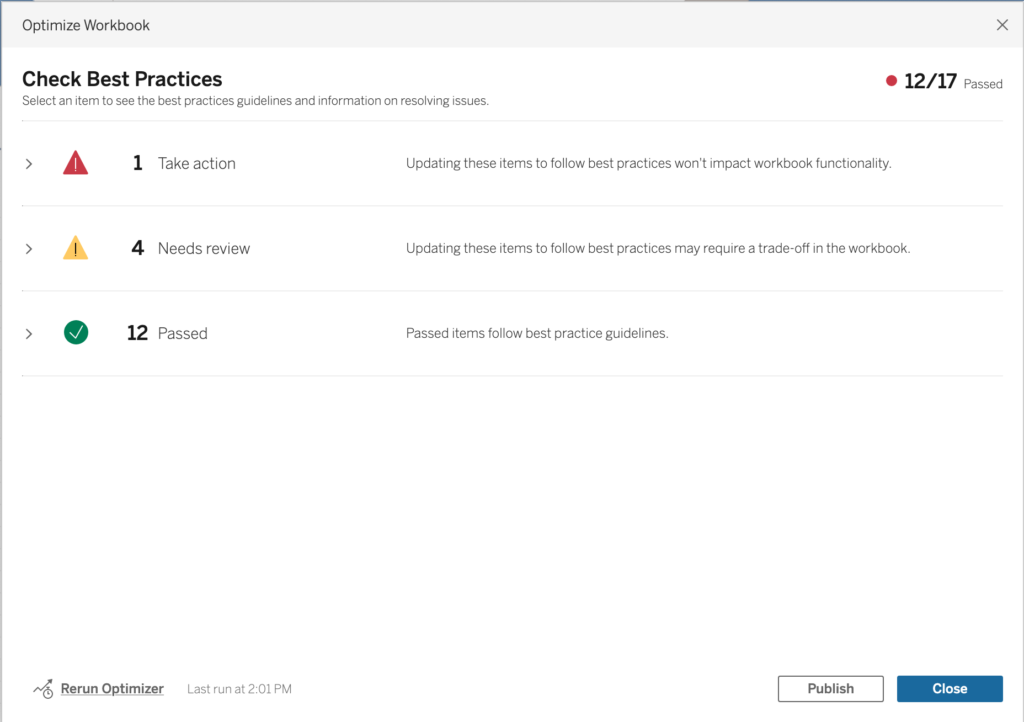
The configuration and interpretation are much simpler when compared to the performance recording. On Tableau Desktop, click Server > Run Optimizer and there you go. The resulting window will look something like this:

The optimizer will automatically evaluate your workbook and compare whether the performance best practices have been applied or not and base it on three categories:
- Passed: The guidelines are met.
- Needs Review: Following these best practices involves modifying the workbook to more depth like restructuring the data source. They will be under “Needs Review” because they need more thought to decide if they can be applied or not.
- Take Action: Following these guidelines will have minimal to no impact on how your dashboard operates and offers. These guidelines should definitely be applied.
One extra benefit of using the Workbook optimizer is also its extra helpful information. Within each guideline. There is a short text with a link to a longer documentation “Learn More” about why this is a best practice for performance. Therefore users can remember these steps better for future projects and learn the best practices more efficiently.

Important to keep in mind that the Optimizer will not solve all of your performance problems. For a more detailed explanation of each guideline, check out this page.
Comparison Table
Just to recap what we have talked about in this blog with the two different tools. Let’s put it through a comparison table to see the similarities and differences.
| Performance Recorder | Workbook Optimizer |
| A Tableau tool you execute that analyses how long each process takes in a separate dashboard. | A Tableau tool that checks if your dashboard follows certain performance best practices. |
| Requires interactions with the dashboard in question to configure. | Does not require interaction with the Dashboard to configure. |
| No guideline is provided on fixing the issues. | Supplementary information is provided for the guidelines. |
| Much more range of performance factors is considered. | Not all factors of performance are checked. |
| The details are specific to the dashboard. | Keeps guidelines general. |
| Older feature | Newer Feature |
| Applies to: Tableau Desktop, Tableau Cloud, Tableau Server | Applies to: Tableau Desktop, Tableau Cloud, Tableau Server |
Thank you for reading this blog. If you would want to see extra best practices to follow for dashboard performance, check out this blog.
Also check out our other blogs page to view more blogs on Tableau, Alteryx, and Snowflake here.
Work together with one of our consultants and maximize the effects of your data.
Contact us, and we’ll help you right away.

