
Background
Using measure names and values fields in Tableau can prove to be very useful for our analytical tasks in Tableau. They do not come with the data but they are automatically generated by Tableau, depending on the data. As is outlined in the name:
- Measure Names: Allow us to reference the names of the measures that exist in our data as a separate field of discrete values.
- Measure Values: Includes all the measures in our data within a single continuous field. Measure values create a separate card with all the measures used for that view referenced in there.
These two generated fields are the most useful when you would like to use multiple measures on the same chart. Such as Combined and Dual Axis Charts.
If you would like to brush up your knowledge on Measure Values and Measure Names before diving into the three tips. You can do so from this link here.
Nonetheless, when working with Measure Names and Values. Certain elements might not be as intuitive to do compared to working with normal dimensions and measures. Such as filtering options and the use of color. In this blog, I will go through three tricks when working with Measure Names and Values in Tableau. These tips include using separate color legends for each measure, how to use measure names as a global filter, and limiting the number of measures in a quick filter setting.
Using Separate Color Legends
As the first tip of this blog, I will showcase that it is possible to use different color legends for each different measure that is in your dataset. By default. It is set to only one color. This is relatively a simple trick compared to the next tips. Nevertheless, it is a great way to differentiate certain measures with their own color palette. See the video below to see how this is done with the Sample Superstore Dataset example:
- First, set your default properties for your measures in terms of their color.
- Build the highlight table with (Profit, Sales, and Count of Orders)
- Right-click the Measure Values field on color and select “Use Separate Legends”
In combination with single select measure names as filters, you can achieve this functionality in another example shown below with maps:
Taken from this example, let’s now move on to how to limit the number of measure names that appear when we use this field as a filter next.
Limit Measure Names in Quick Filters
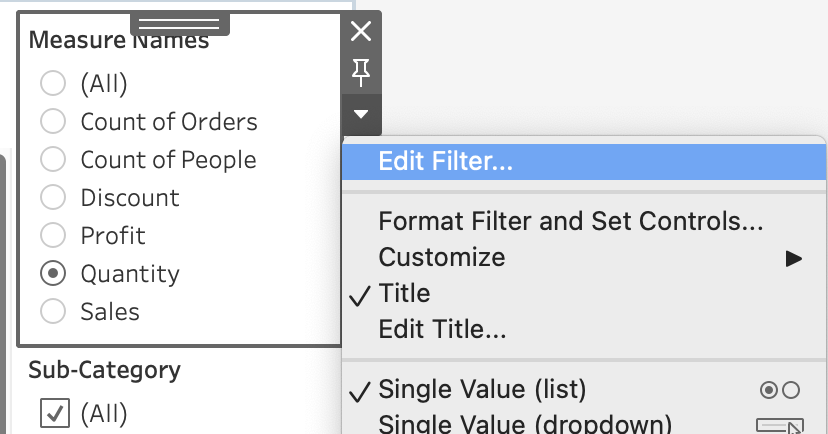
You might have noticed that when you use Measure Names as a quick filter, all of the measures that exist in your data show up on the filter. To limit the number of measures that appear on your interactive quick filter, you can just hide the measures you don’t want to see. After that, those measures will disappear from the quick filter. See the video below for an example:
However, what if you still want to use those hidden measures in other parts of your analyses and visualizations, but do not want them to show up on the Measure Name quick filter? Then, you will need to take a different approach.
First, you will need to duplicate your data source. From this duplicate data source, rebuild or build other visualizations. After that, you can hide the desired measures in the same way as shown in the video before. Or if you know you used already all the ones you need, click “Hide all Unused Fields” from the dropdown menu of the data pane. Put your quick filter on afterward from Measure Names and see that the hidden fields are not there. See the video below for a run-through:
Doing it this way will allow you to use/hide different measures in between sheets and in the end can all be used in a dashboard.
Using Measure Names as a Global Filter
In the previous tip, we showcased using Measure names as filters. But what if we want to use one global filter that will change multiple sheets in a dashboard? I will just outright say that it is currently not possible to use measure names as a global filter that works across multiple sheets in a dashboard like other dimension or measure filters are. However, that does not mean we cannot have them as a global filter at all. We just need to do some data manipulation.
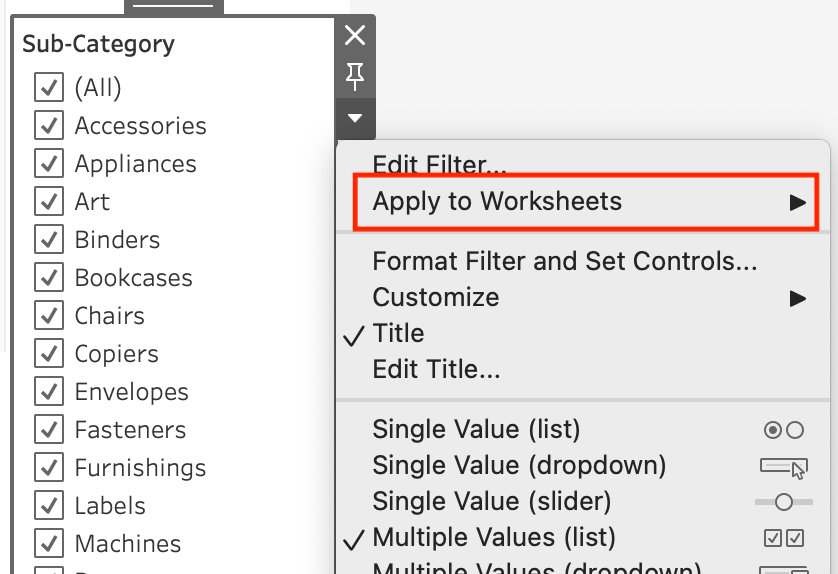
Pivoting is the crucial action to do in this case. If we pivot our fields, we can get one field for all the measure names and one with its values. This way we can use the new field with the names as the global filter that acts as a measure name filter. When we access more options from a filter in a dashboard, we can see the “apply to worksheets” selection on it. But that option does not exist for Measure Names when it is used as a filter.
Let’s say I would like to only use Profit, Sales, and Quantity as my measures from the Superstore Sample Data. I will pivot those measures from the data source from a wider setting to a taller one. Check out this link if you would like to know more about pivoting in Tableau. Otherwise, check out the video below for a demonstration of this case:
Final Remarks
Hope the content in this blog has helped you with your work and knowledge on Measure Names and Values. Thank you for reading this blog.
Check out our blogs page to view more blogs on Tableau, Alteryx, and Snowflake here.
Work together with one of our consultants and maximize the effects of your data.
Contact us, and we’ll help you right away.