
When I study, I like to create tree diagrams, colorful mind maps and really anything that will help the information sink deeper into my memory and understanding.
While studying for the Snowflake certifications, I reproduced the information concerning Snowflake roles on paper:

Once I was done, I thought it would be handy to create a tree diagram in Tableau, and leverage Tableau’s interactivity to have the information about each role appear and disappear at will.
Indeed, as most things in Tableau, it is possible! Inspired by Dustin Wyers’ post, I decided to approach the diagram using filter actions. Here are the steps I followed.
Create a tree diagram in Tableau: the steps
THE DATASET
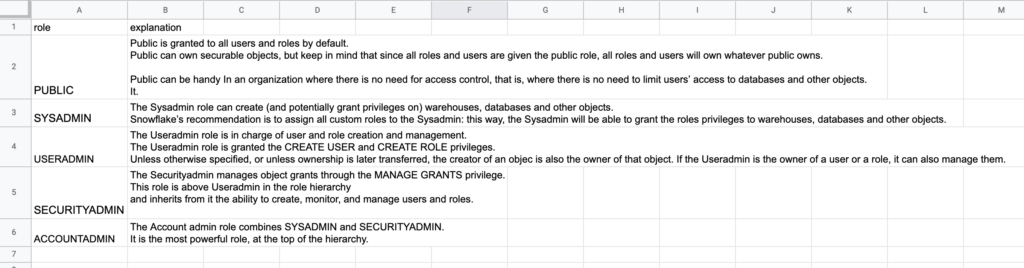
I created a small dataset in Google sheets with two columns: role and description and connected to it via Tableau
CREATING THE SHEETS
Then, I created two sheets for each role. Let’s take the Public role as an example. On one sheet, which I called “public role”, I dragged “role” to rows, and then filtered “role” and selected only “Public”.
On the second sheet, which I named “public expl”, I repeated the same setting, but this time I dragged “explanation” to rows, and again I filtered it selecting only the explanation for the public role.
Then I duplicated the two sheets for each other role, and made sure to change the filter appropriately. At the end of this process, I had ten sheets, two for each role.
THE DASHBOARD
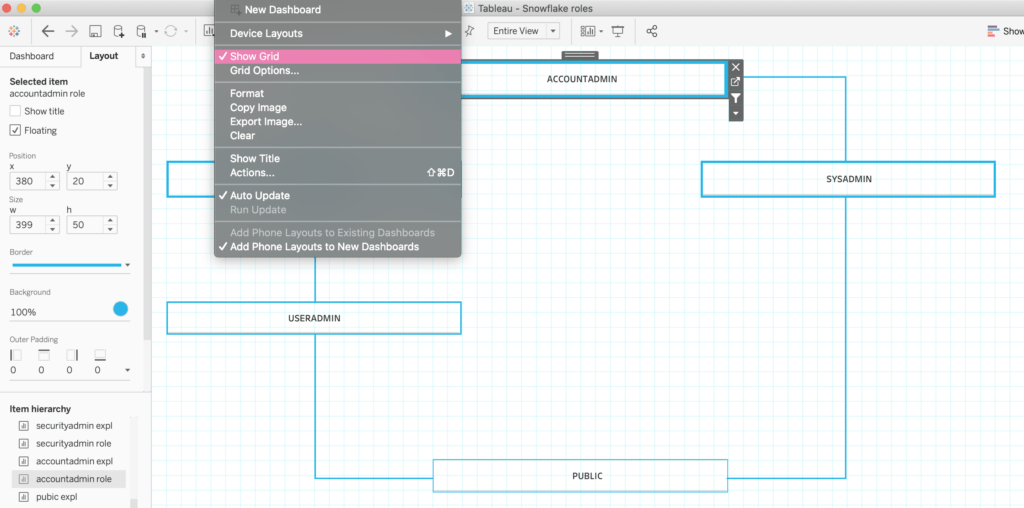
Once the sheets were ready, I created a new dashboard and selected floating instead of tiled objects. I then dragged the 10 sheets onto the dashboard to mimic the tree diagram in the picture above. I made sure to have the role title and the role description one on top of the other.
HIDE AND SHOW THE DESCRIPTION BOXES
How can you make sure that the role description only pops up when the role is clicked on? For this trick, I used filter actions.
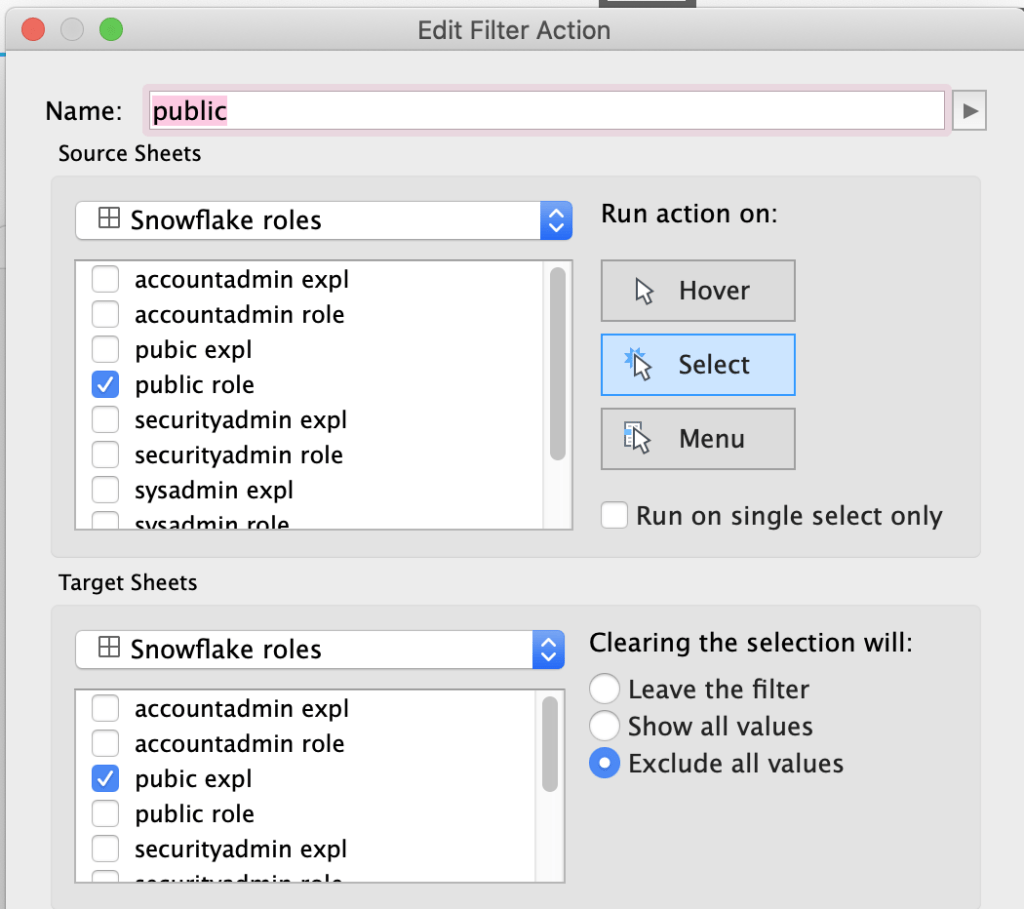
I created 5 filter actions, one for each role. Let’s take once again the Public role as an example. I set “public role” as the source sheet and “public expl” as the target sheet, making sure that all the other sheets are unselected. This is important: if other sheets are selected, clicking on the public role name in the diagram will show the description for other roles too, whereas in this case we would like the roles to show their description independently from each other.
Once you selected the correct sheets, choose to run the action on Select and set the filter so that clearing the selection will exclude all values.
CREATING THE DIAGRAM
In order to create the diagram itself, I added some blanks onto the canvas. I chose the same blue as the Snowflake logo for the blanks’ background color, and given the horizontal lines a hight of 2, and the vertical ones a width of 2.
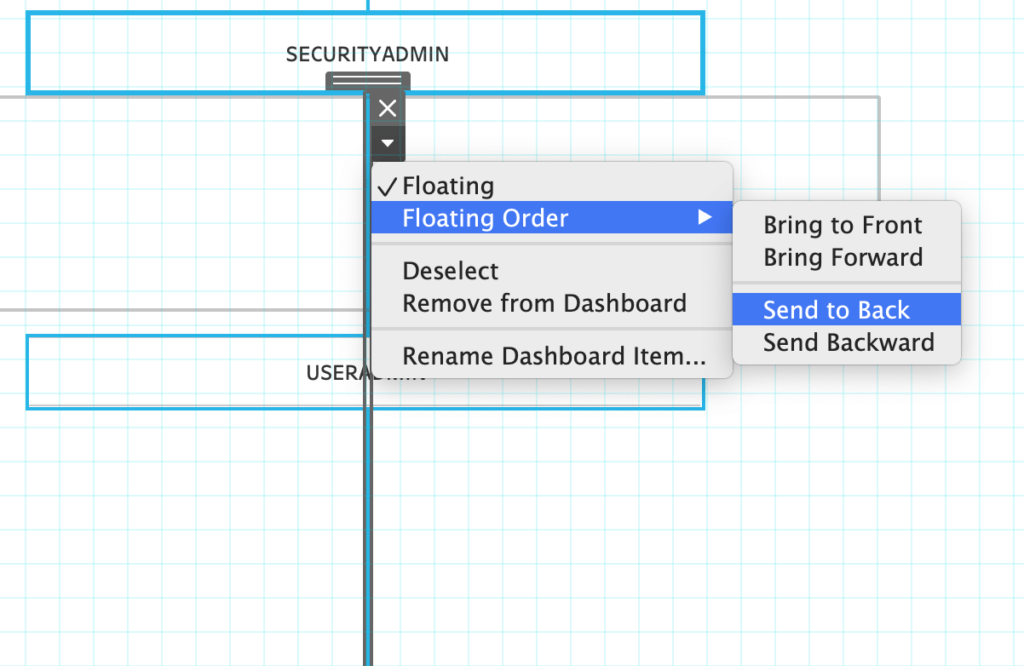
I found it handy to create one unique line all the way down and selecting Floating order “Send to back” to make sure the description box would cover the line when selected.
Finally, I leveraged the “Show grid” functionality and the layout position and size section to align the lines and boxes properly.
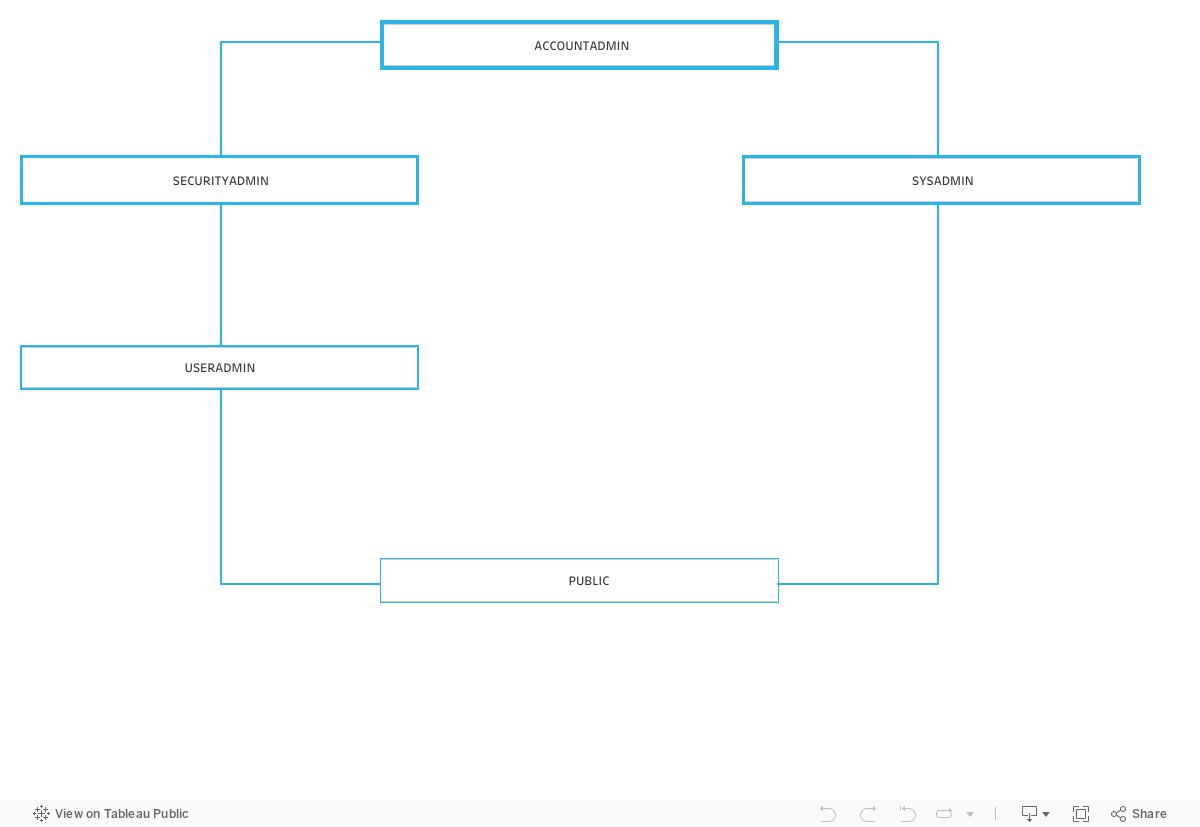
The result
And here is the final result! A clean, blue on white tree diagram, quite handy to remember the ability of each Snowflake role in the future. Indeed, this diagram can be adorned with fancy images, for instance by adding the Snowflake logo or a background image. Follow the steps above to build your own interactive tree diagram!
Do you want to learn more about Tableau, Alteryx or Snowflake? Do you want to use these tools to their full potential? Check out our trainings and consultancy services!