
I want to find the distance between a restaurant and all the customer locations.
I have two datasets:
- Dataset A contains just one row with the address, latitude and longitude of an Italian restaurant.
- Dataset B contains a list of addresses, latitudes and longitudes of customers.
In order to find the distance between the restaurant and the customer locations, I need to use the Distance Tool. However, the Distance Tool only accepts one input.
The trick here is to first create a cartesian join with the Append Fields Tool, and then use the resulting table as input for the Distance Tool. A cartesian join creates a row for each possible combination of Dataset A and Dataset B.
The result will be a table with a customer location and the restaurant location on each row. We can then use these two columns in the Distance Tool, and find the distance between the restaurant and each customer location.

Distance between one point and multiple points (two datasets), step by step
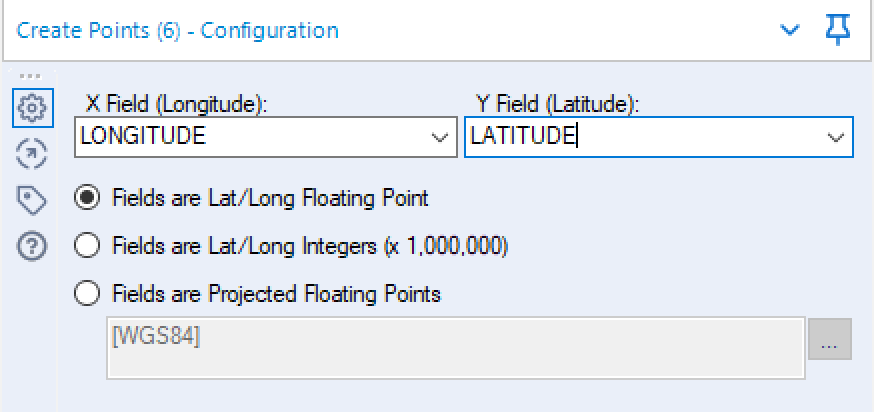
1. Firstly, we need to make sure to have a point (a spatial object) for each address. To do that, we will feed the latitude and longitude columns to the Create Points Tool, for both datasets.
2. After that, we have the option of using a Select Tool to only select the columns we really need. For example, I will drop the latitude and longitude fields.
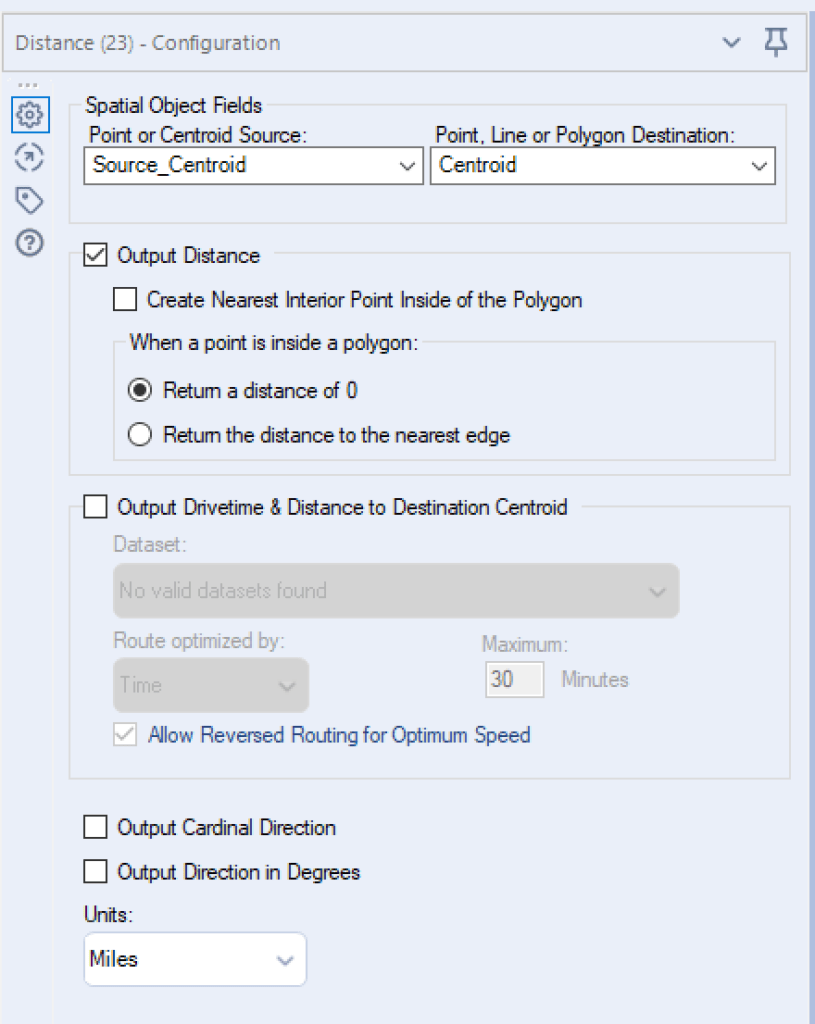
3. Thirdly, we need to use an Append Field Tool. We will connect Dataset A, the one with the restaurant address, to the S (Source) anchor and Dataset B to the T (Target) anchor. In my case, I unchecked the “Output Cardinal Direction” box as I don’t need it, and selected miles as units.
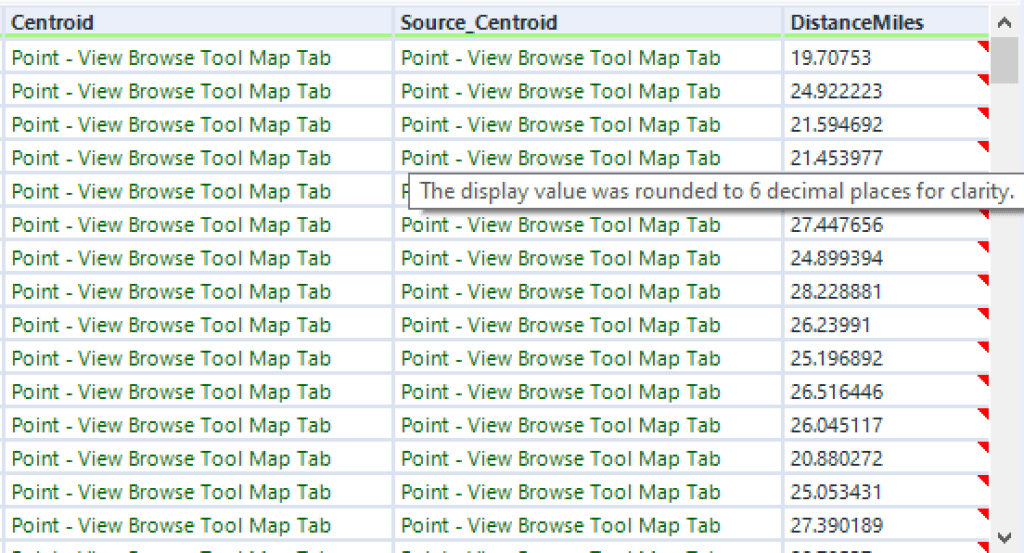
And that’s it, you have found the distance between one point and multiple points! The result should look something like the image below. As you can see, the whole column presents a red rectangle on each cell. But no panic! While hovering over a cell, a message informs us that the number has been rounded up to the 6th decimal place after the comma.
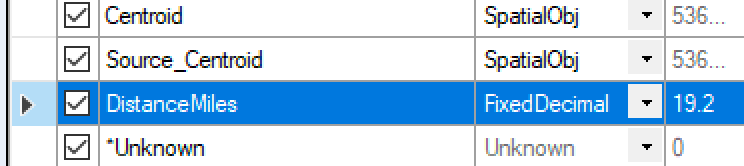
If we are not looking for infinitesimal precision, we can add a select tool after the distance tool and change the data type to FixedDecimal. This will allow us to determine the amount of decimal after the comma, and to get ride of the red rectangles.
Select Tool settings:
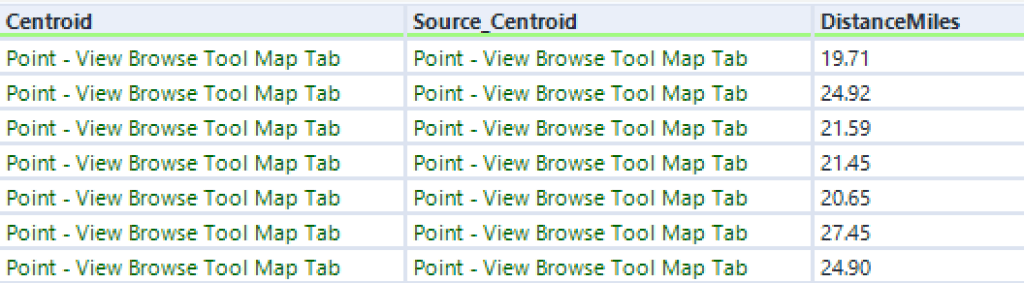
Final results:
Do you want to learn more about Tableau or Alteryx? Do you want to use these tools to their full potential? Check out our trainings and consultancy services!