
In this visualisation about the Winter Olympics, I have created a bar chart that shows medals by year won by the Netherlands team. In the tooltip, we can see the number of medals won by the athlete during his career. To filter the viz in the tooltip by athlete and not by all fields in the current view, I had to manually change the filter in the tooltip window.
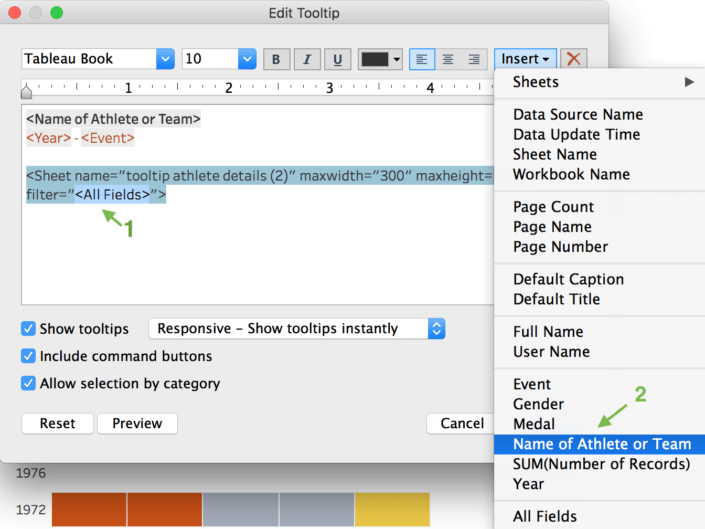
In the tooltip editor, when I add the sheet with the Insert Menu in the top right section, I obtain this:
- <Sheet name=”tooltip athlete details” maxwidth=”300″ maxheight=”300″ filter=”<All Fields>”>
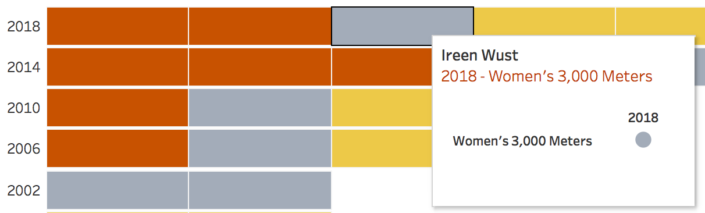
By default, the viz in tooltip is filtered on “All Fields”, so when I hover over “Ireen Wust” in 2018, I see only her medal won this year in the Tooltip.
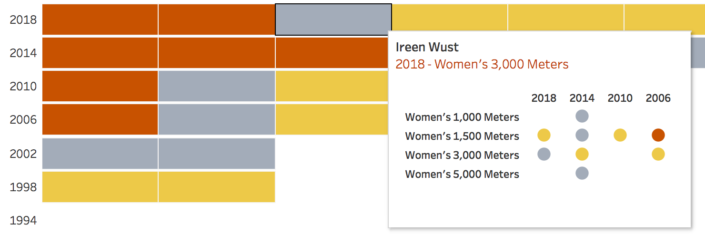
What it interests me is to see the total medals she won over the past few editions of the Winter Olympics:
To show this view, I open the tooltip editor and select <All Fields > with the cursor. Then, in the Insert Menu, I choose <Name of Athlete or Team>.
- <Sheet name=”tooltip athlete details” maxwidth=”400″ maxheight=”400″ filter=”<Name of Athlete or Team>”>
And that’s it! Now when we hover over a bar, we see in the tooltip the medals won by year automatically filtered for that athlete.
Tableau Tip: While making this chart, I also wanted to show when the Netherlands team didn’t participate. By default, Tableau hides missing values.
To show Empty Rows: Go to the top menu, choose Analysis, then Table Layout and select Show Empty Rows
Do you want to learn more about Tableau or Alteryx? Do you want to use these tools to their full potential? Check out our trainings and consultancy services!