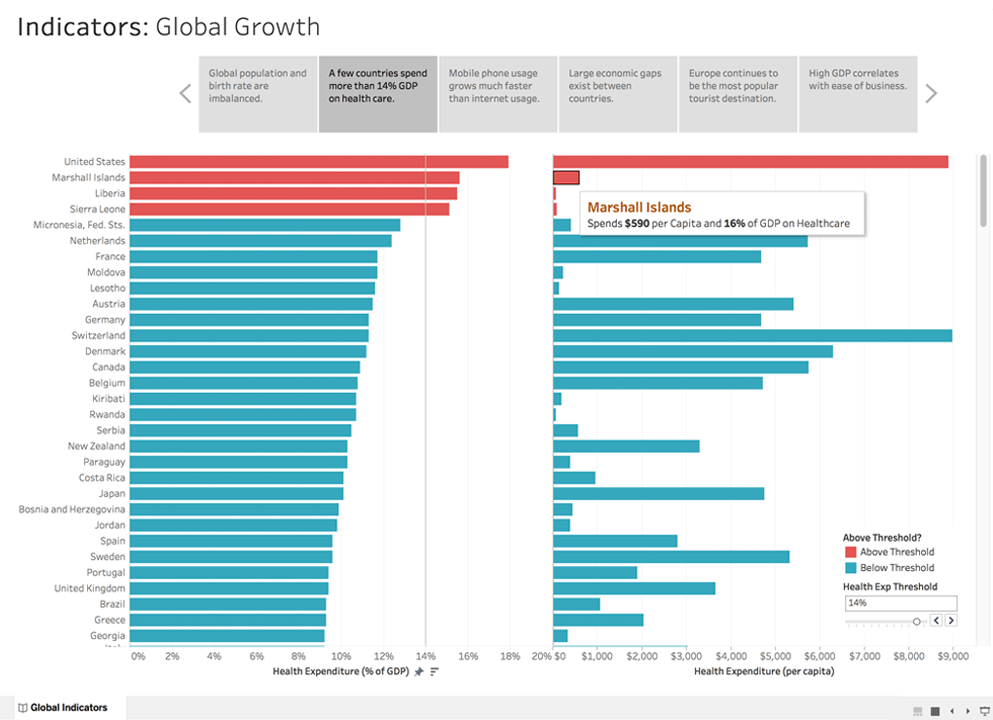
Data Analyze and Visualize in Tableau Desktop

Tableau Desktop is installed on a local desktop or laptop. With Tableau Desktop you can create links to an unprecedented number of different data sources (>100).

You can then link this data and translate it into visualisations in the form of interactive reports and dashboards.
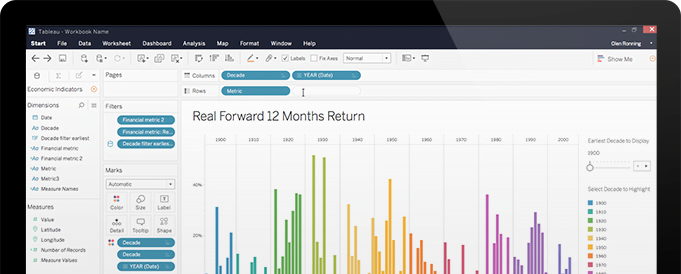
data-src="https://theinformationlab.nl/wp-content/uploads/2022/02/Desktop-animate.gif"
Visualize Your Data In Minutes

Immediate actionable insights

Leave the graph makers behind. Live visual analytics fuel endless data exploration. At any moment, interactive dashboards help you uncover hidden insights. Tableau harnesses people's innate ability to quickly recognise visual patterns. It reveals both the mundane possibilities and the grand eureka moments.

Key benefits

Connect with more data

Connect to local and cloud data - whether it's big data, a SQL database, a spreadsheet or cloud applications like Google Analytics and Salesforce. Access and combine different data without coding. Experienced users pivot, split and manage metadata to optimise their data sources. Analytics start with data. Get more out of it with Tableau.
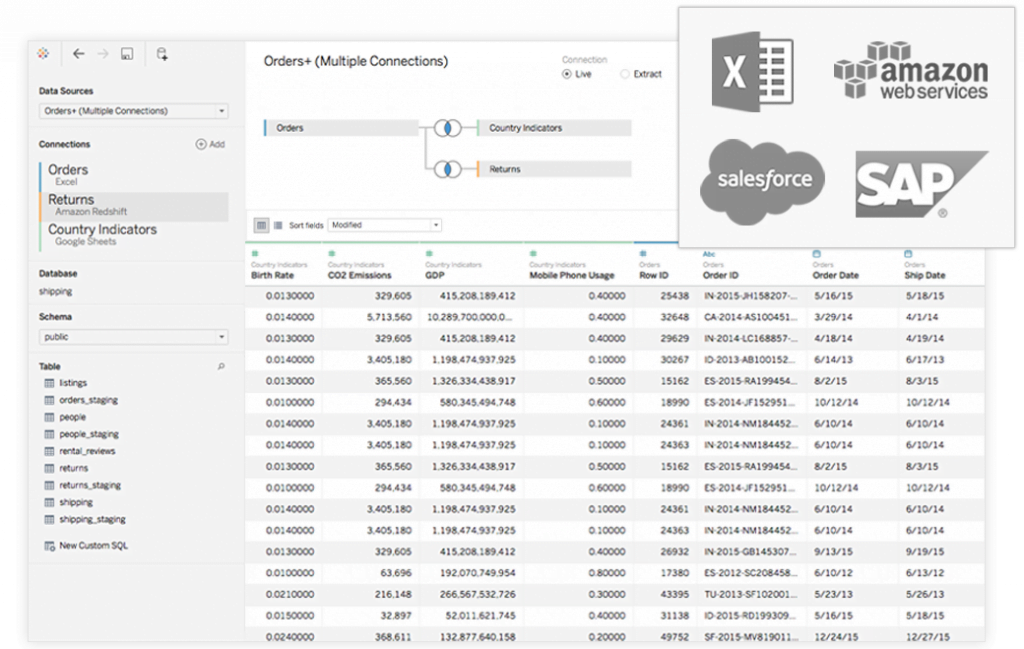
data-src="https://theinformationlab.nl/wp-content/uploads/2022/02/data_section2_2-1024x649.png"
data-src="https://theinformationlab.nl/wp-content/uploads/2022/02/answer-deeper-questions.gif"
Visualize Your Data In Minutes

Answer complicated questions

Exceptional analytics need more than a pretty dashboard. Use existing data, drag-and-drop reference lines and forecasts to make powerful calculations and evaluate statistical summaries. Make sense of trend analysis, regression analysis and correlations to create proven statistical understanding. Ask new questions, discover trends, identify opportunities and make data-driven decisions with confidence.
Key benefits

Create interactive maps in Tableau Desktop
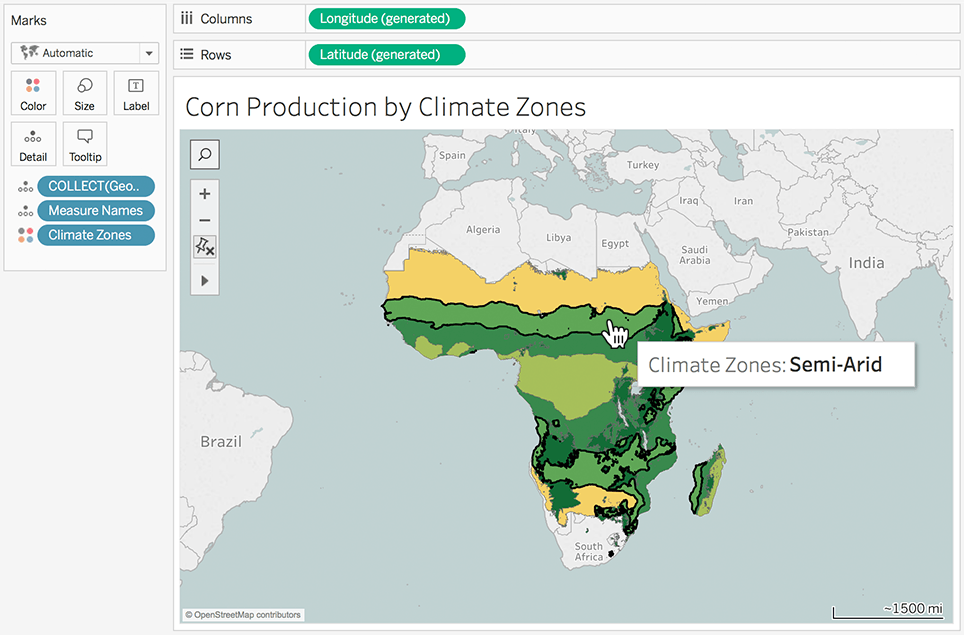
In Tableau Desktop, answer the "where" question as well as the "why" question. Create interactive maps automatically. Map more than 50 countries around the world with built-in postal codes. Use custom geo-codes and areas in Tableau Desktop for personalized regions, such as sales territories. Tableau maps is designed to do data justice.
data-src="https://theinformationlab.nl/wp-content/uploads/2022/02/maps2small.png"
data-src="https://theinformationlab.nl/wp-content/uploads/2022/02/story_1.png"
Visualize Your Data In Minutes

Everyone can know

Replace static slides with live stories that others can view. Create a compelling report that allows everyone you work with to ask questions, by analysing interactive visualisations with fresh data. Be part of data collaboration and increase the impact of your insights.
Tableau Dekstop can be purchased from The Information Lab.

Tableau Desktop Licences

Did you know that our customers receive free support and have access to our Centre of Excellence?


We are happy to help you

Request a free demo