
Wie de Gardner Magic Quadrant voor 2023 bekijkt, ziet wat hij of zij waarschijnlijk al wel wist: Tableau (Salesforce) en Power BI (Microsoft) steken met kop en schouders boven...
Wie de Gardner Magic Quadrant voor 2023 bekijkt, ziet wat hij of zij waarschijnlijk al wel wist: Tableau (Salesforce) en Power BI (Microsoft) steken met kop en schouders boven...

Imagine you're creating a chart and you want to add a certain shape or icon that is not available in Tableau's default shape palette. For example, what if you...

In a time where data-driven decisions shape our world, it's crucial that data visualizations are accessible to everyone. Many BI tools offer a wide range of features to ensure...

It's that time of the year again. The days are getting shorter, the nights are getting colder and if you live in the Netherlands, the kruidnoten are already in...
A fundamental aspect of creating impactful visualizations in Tableau involves using calculations. Tableau offers three main types: Basic Calculations, Table Calculations and Level of Detail (LOD) calculations. Each type...
TC23, this year's Tableau conference, has been over for a while. Some 8,000 members of the #DataFam gathered in the wonderful world called Las Vegas....
Less is more. As data analysts we don't want to see tables with dozens of columns and millions of rows! We just want to see a visual summary. But...
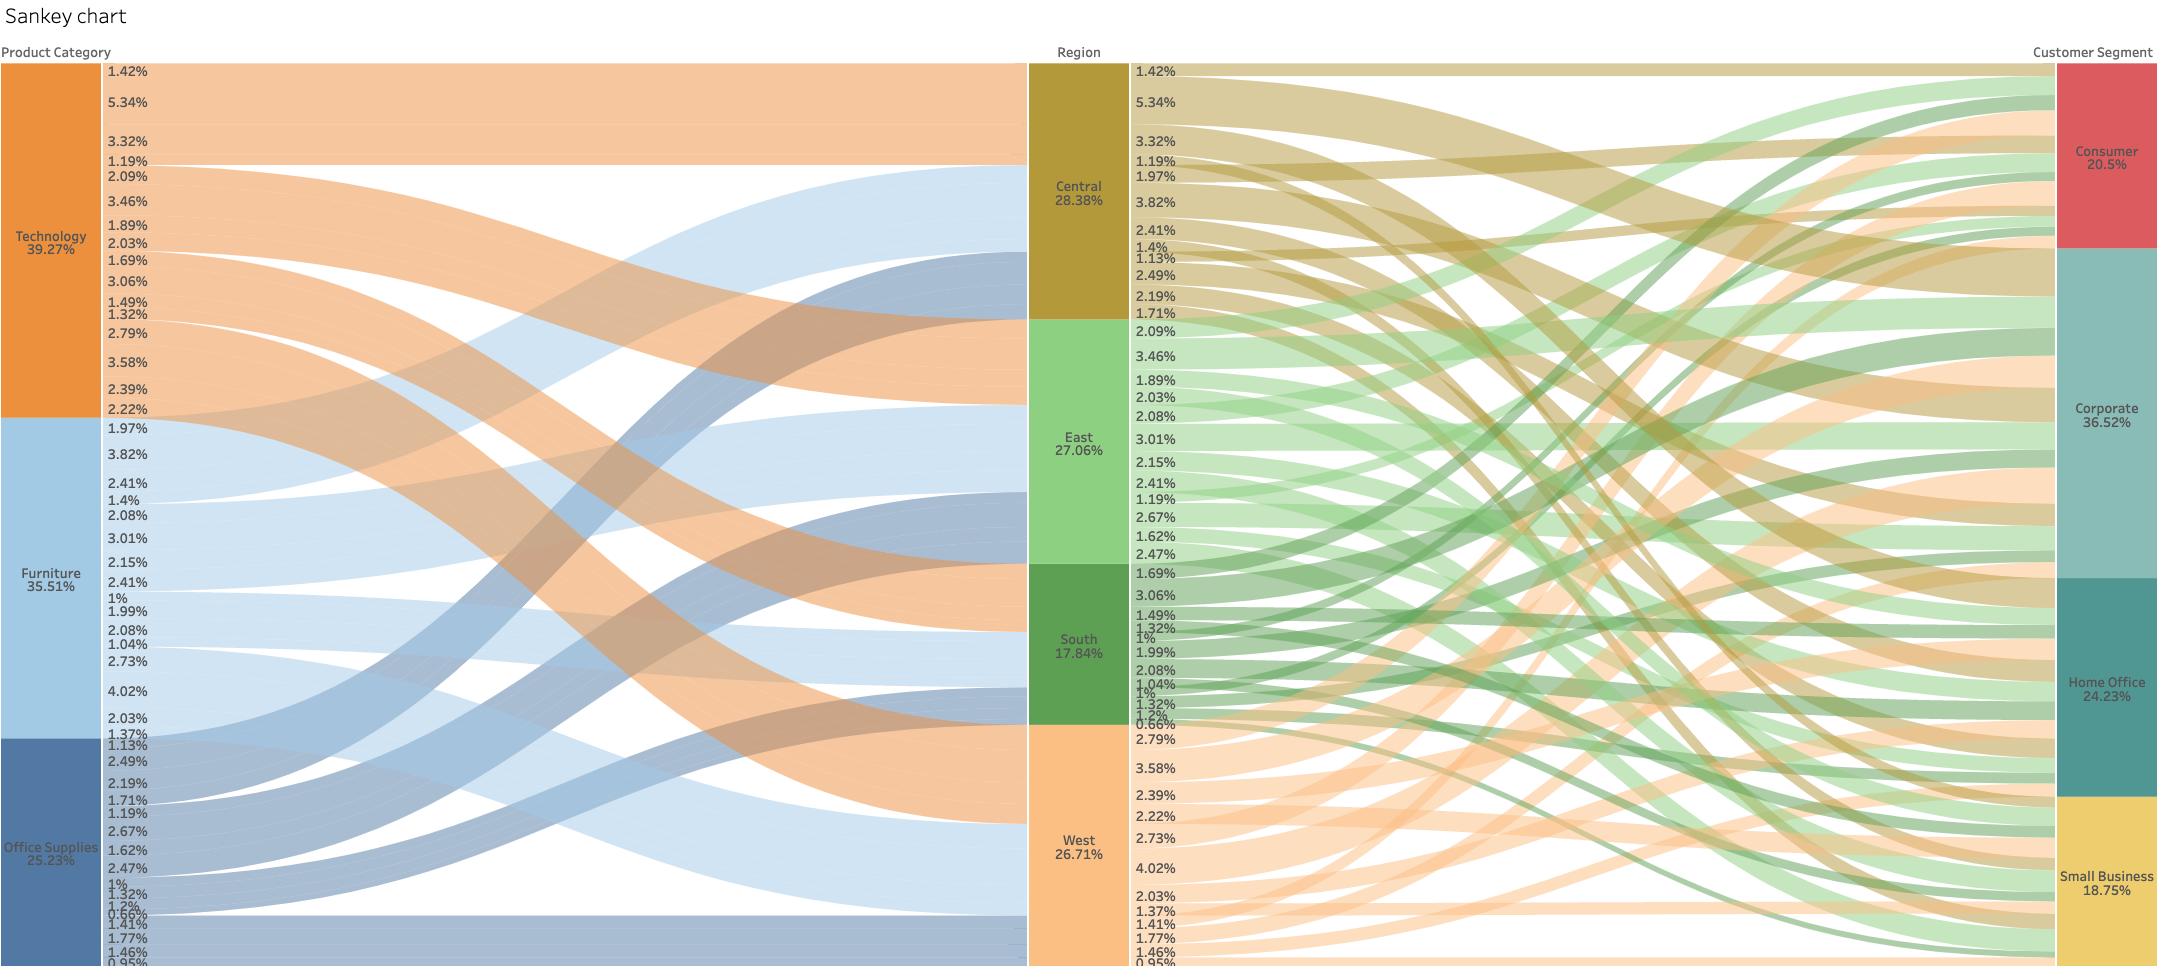
Data visualization is a crucial aspect of modern data analysis, and Tableau has long been a go-to tool for creating beautiful and informative visualizations. With the release of Tableau...