

Imagine you're creating a chart and you want to add a certain shape or icon that is not available in Tableau's default shape palette. For example, what if you...

In a time where data-driven decisions shape our world, it's crucial that data visualizations are accessible to everyone. Many BI tools offer a wide range of features to ensure...

Introduction The Dynamic Zone Visibility feature in Tableau has been around for almost a year from today and there are a lot of different use cases on how they...
TC23, this year's Tableau conference, has been over for a while. Some 8,000 members of the #DataFam gathered in the wonderful world called Las Vegas....
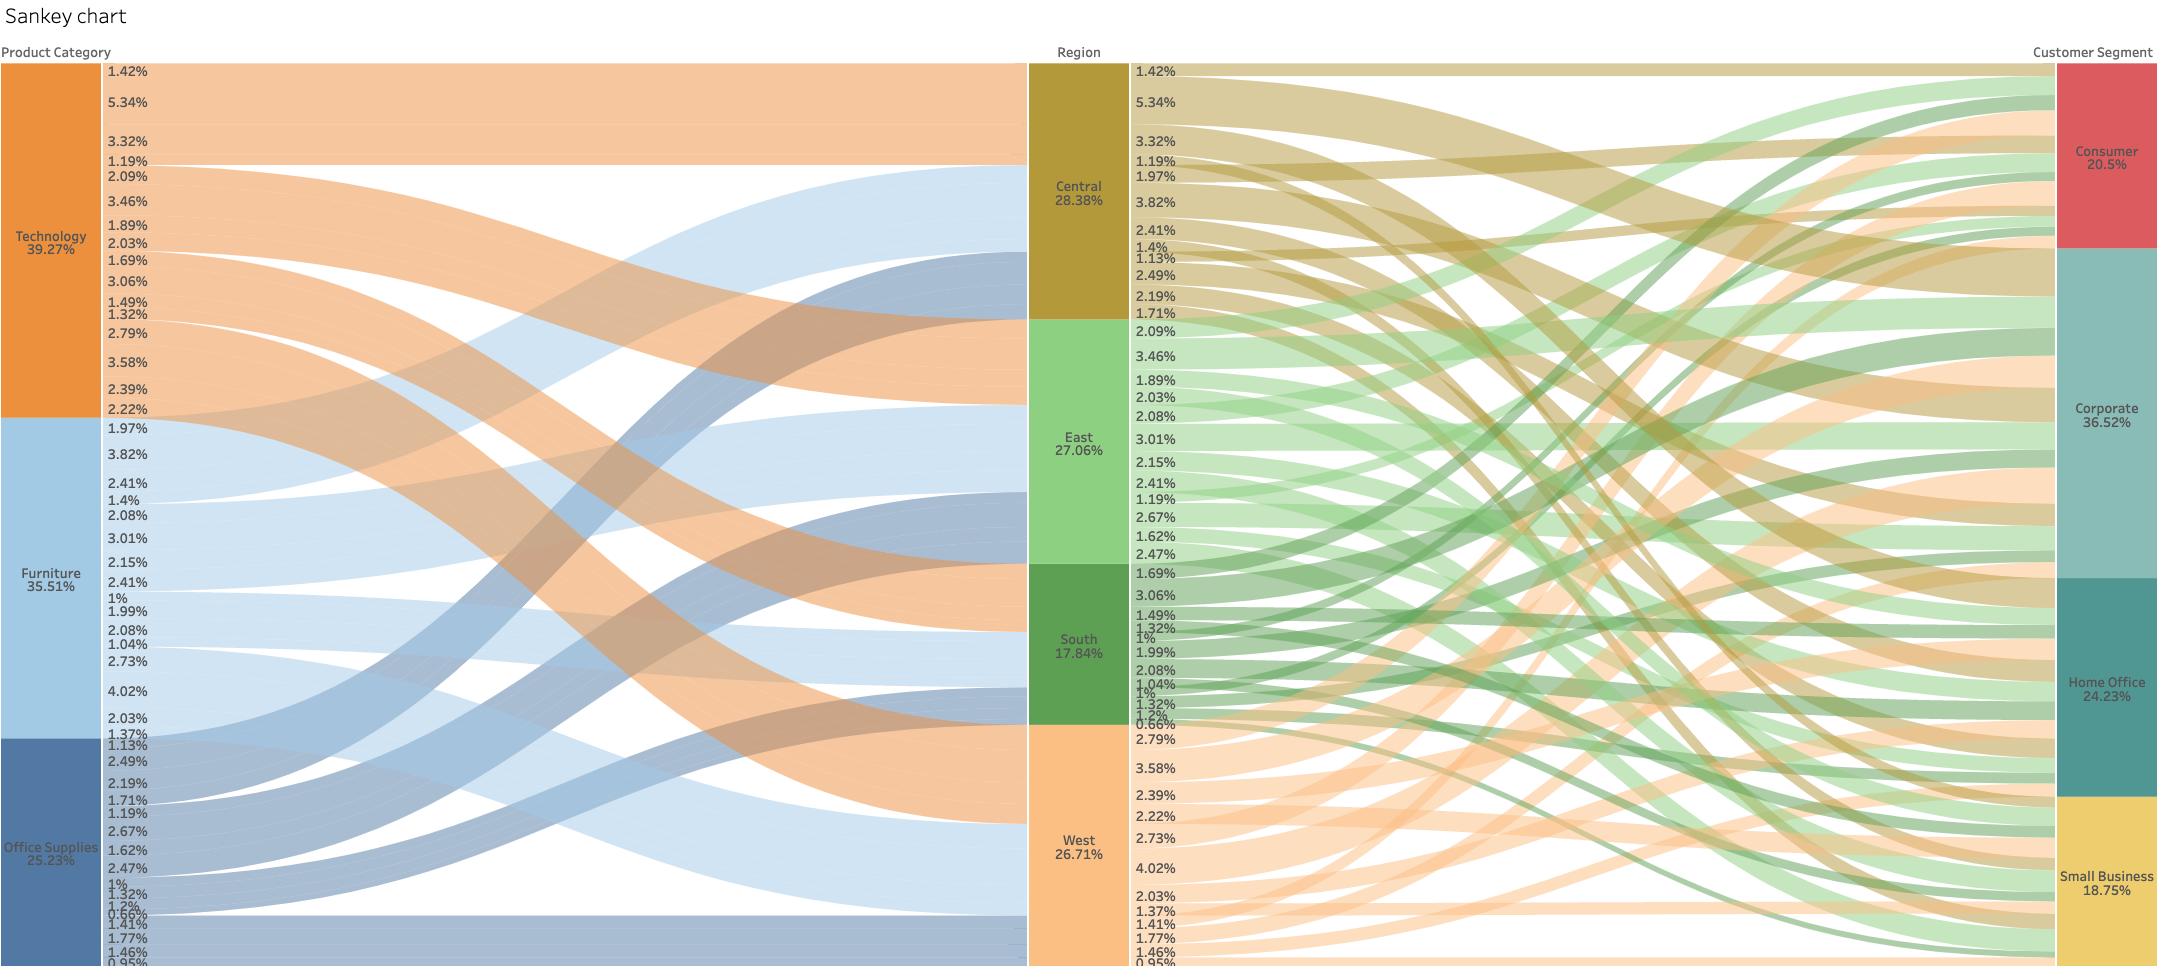
Less is more. As data analysts we don't want to see tables with dozens of columns and millions of rows! We just want to see a visual summary. But...

Suppose a dashboard needed to show how many hours were spent per role/function in a project. The dashboard needed to show what the...
How do you keep the departments of HR, who wants to see hours worked by month, and Finance, who wants to see everything with ISO? In other words, how do I get hours worked in months and...
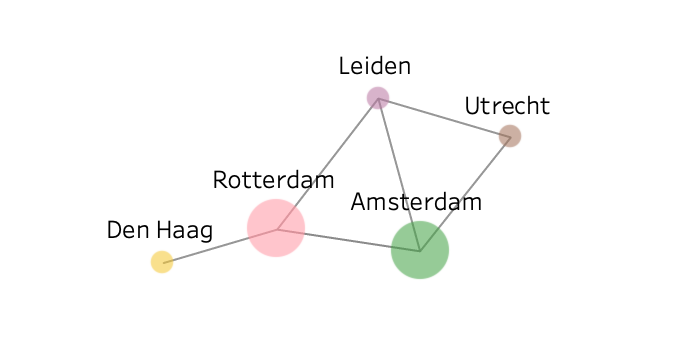
A network graph (also known as a link chart, a node-link diagram, a network map, or just a graph) represents a collection of interlinked entities. This type of graph...
If you have been working with data for some time you will probably have seen, or even created, several dashboards. You may find that you don't understand the concept of a dashboard and how...