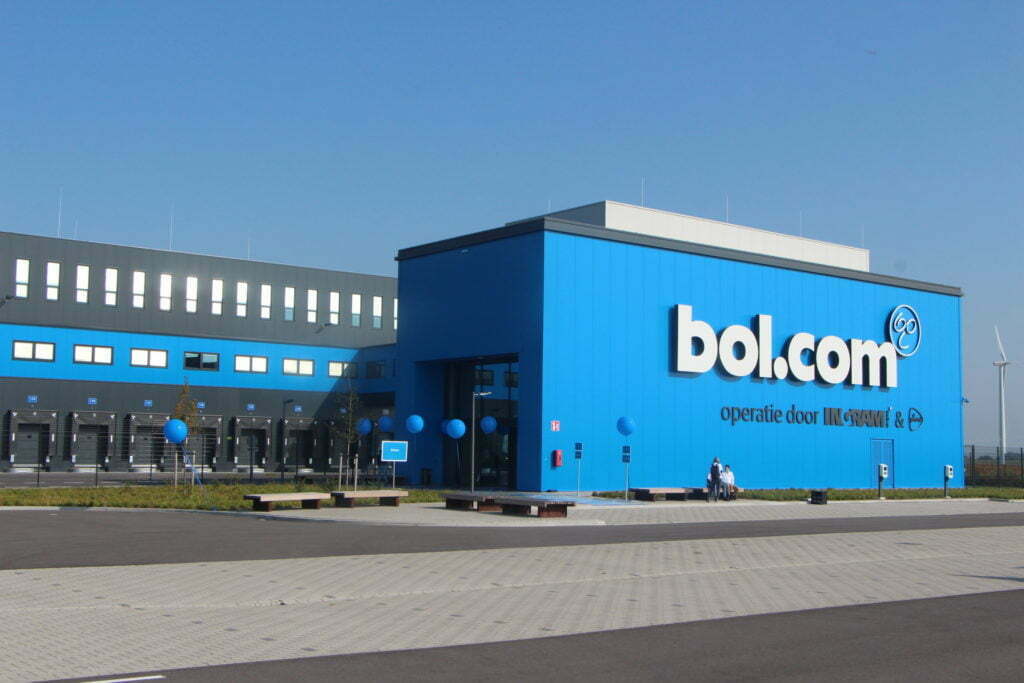

"Flexibility plays a huge role. The ability to respond quickly to changing consumer habits has always been critical in retail, but that's especially true for online, where shoppers will quickly go elsewhere if we don't have exactly what they want, when they want it."
"You know how in every epic story, the main character gets help from an unexpected new friend that just happens to possess that one missing skill, The Information Lab is that special friend."
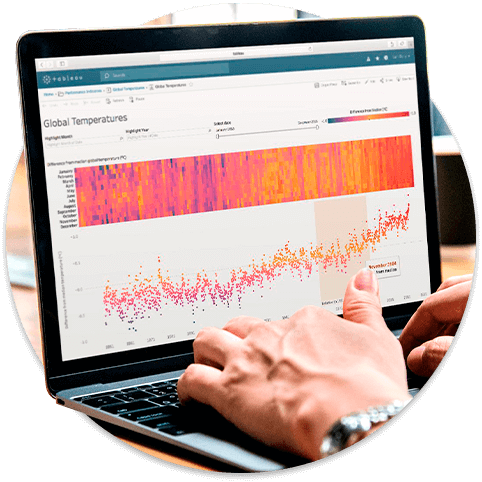
"With the new self-service cloud data platform, which we established and set up with The Information Lab, all information is offered to the organization in one central place, securely and easily."

"Consulting by The Information Lab is definitely recommended. I have spent the past few weeks gathering my questions and discussing them all with a consultant in one day. I am looking forward to the next session!"
"Flexibility plays a huge role. The ability to respond quickly to changing consumer habits has always been critical in retail, but that's especially true for online, where shoppers will quickly go elsewhere if we don't have exactly what they want, when they want it."
"You know how in every epic story, the main character gets help from an unexpected new friend that just happens to possess that one missing skill, The Information Lab is that special friend."

Stored Procedures vs. dbt: A Data Engineer’s Survival Guide
Picture this: You’ve just joined a new company, and the previous data engineer—let’s call him Bob—has left for a remote...

Upgrading dbt Core and its Adapters: A Practical Guide
Upgrading software—the thing we all know we should do but sometimes fear because "if it ain’t broke, don’t fix it,"...

The Future of dbt: What SDF Labs Brings to the Table (Literally)
Introduction For the last few years, dbt has been a staple in the modern data stack, allowing analytics engineers to...


Tableau Training Desktop I: The Basics
795
Two-day training for beginners and users with some experience. This training covers the most important concepts and techniques in Tableau Desktop.
- Level: beginner
- 2 days
- Virtual / online
Tableau Training Desktop II: Advanced
795
Two-day training is for the professional with experience of working with Tableau who wants to take their work to the next level.
- Level: advanced
- 2 days
- Virtual / online
Alteryx Core Concepts training
990
The Alteryx Core Concepts training gives you a solid foundation for further work with Alteryx. You will learn all the core tools, which you can use over and over again in all the workflows you build.
- Level: beginner
- 2 days
- Virtual / online

PowerBI Desktop: Fundamentals
795
Power BI Desktop Fundamentals helps you understand and apply the basic techniques of Power BI so that you can move effortlessly from simple to advanced visualizations.
- Level: beginner
- 2 days
- Virtual / online