
Schakelen tussen Table Calculations (percentage)
Het kan soms handig zijn om een dynamische crosstab of tabel te hebben waarbij je kunt schakelen tussen dimensies én...
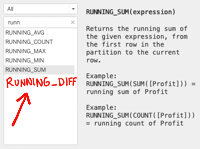
How to calculate a Running Difference in Tableau
Have you ever encountered the need to calculate the difference in a measure row compared to the value of the...
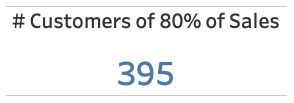
KPI: # of Dimension that is Percentage % of a Measure in Tableau
Have you ever had the need to create a KPI that represents the # of *dimension* that represents the X%...
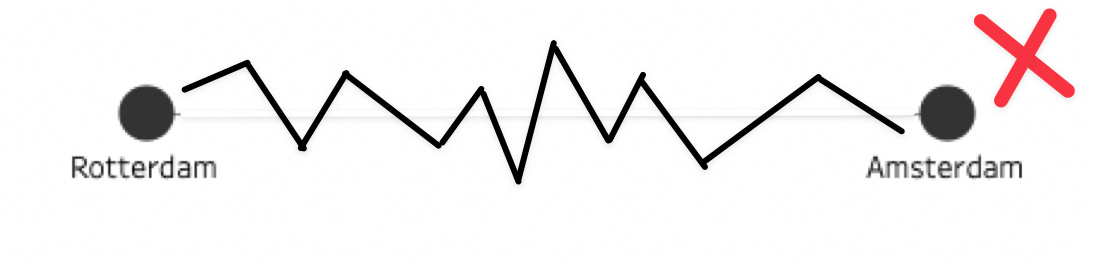
Tableau Network Graph Limitations
Network graphs are a specific visualization that helps you to analyze interactions and connections between entities. Although network graphs are...
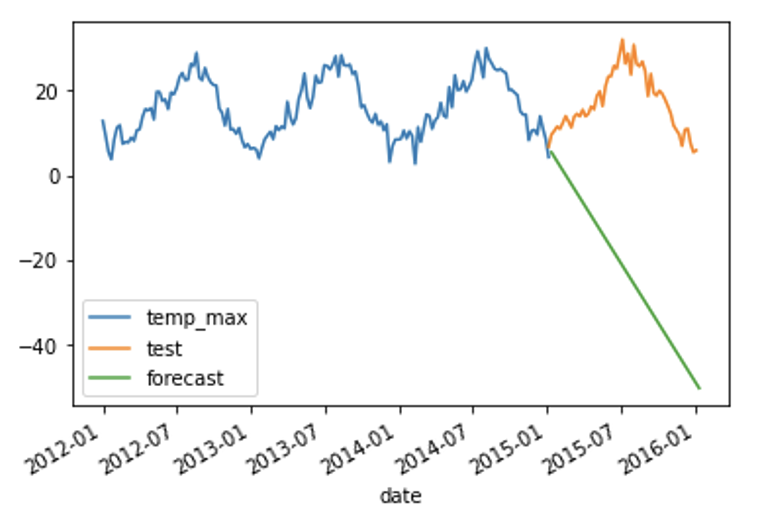
Why should you add exponential smoothing to your forecasting toolkit
Time series data is a collection of data points recorded over time, that are used to analyse trends and patterns...
Hoe overtuig ik mijn collega’s om data te visualiseren in plaats van te bekijken in tabellen
Om mensen ervan te overtuigen dat data visualisatie beter is dan tabellen, is het belangrijk om de voordelen van visuele...