
Why your Brain Loves Visuals and How It Makes Sense of Them
Isn’t it amazing how our brains are absolute rockstars at decoding visual cues? Inside our brain sight has the highest...

3 Ways to Improve Text Table-related Performance Issues in Your Tableau Dashboard
I recently stumbled upon a performance issue in a Tableau dashboard where I included two tables that were displaying around...
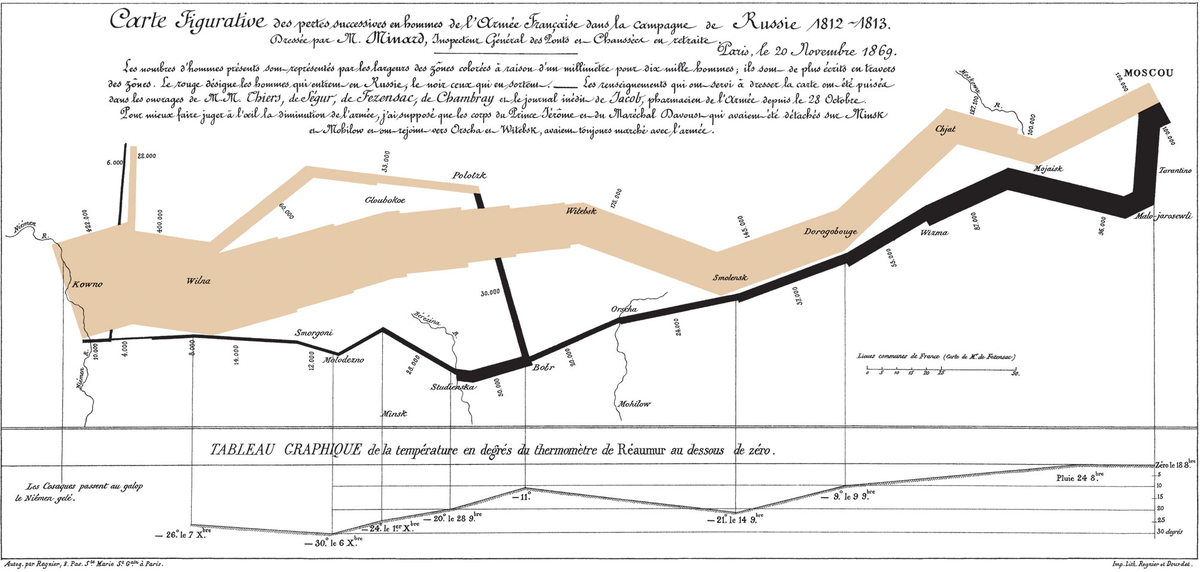
History of Visual Analytics
History of Visual Analytics Welcome to this blog series on Visual Analytics! Over the coming weeks, I'll guide you through...

Why monitoring your analysis after production is important
This blog is part of a series. You can find the first one here.You have just completed your project and...

Start PoC innovative regional Datasharehouse for 10 VVT organizations in Amsterdam and Amstelland- Meerlanden
10 VVT institutions, in collaboration with Sigra (the regional partnership of 150 health and welfare organizations), have taken the next step in...

From DIY Disaster to Macro Magic: Cleaning Up Old Snowflake Tables with dbt
You're deep into managing your data warehouse, when suddenly you realize your Snowflake instance has accumulated digital cobwebs - A...