
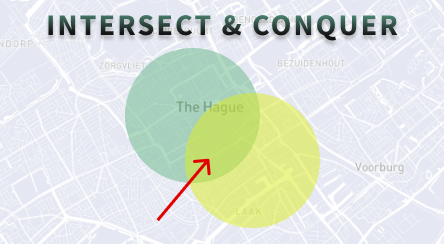
Tableau is an extremely powerful tool for data analysis. In recent years, it has also added many functionalities for spatial analysis. One of the many useful features in...

The end of 2022 is already in sight and 2023 is just around the corner. We've welcomed a lot of great new features for Tableau, Alteryx and...
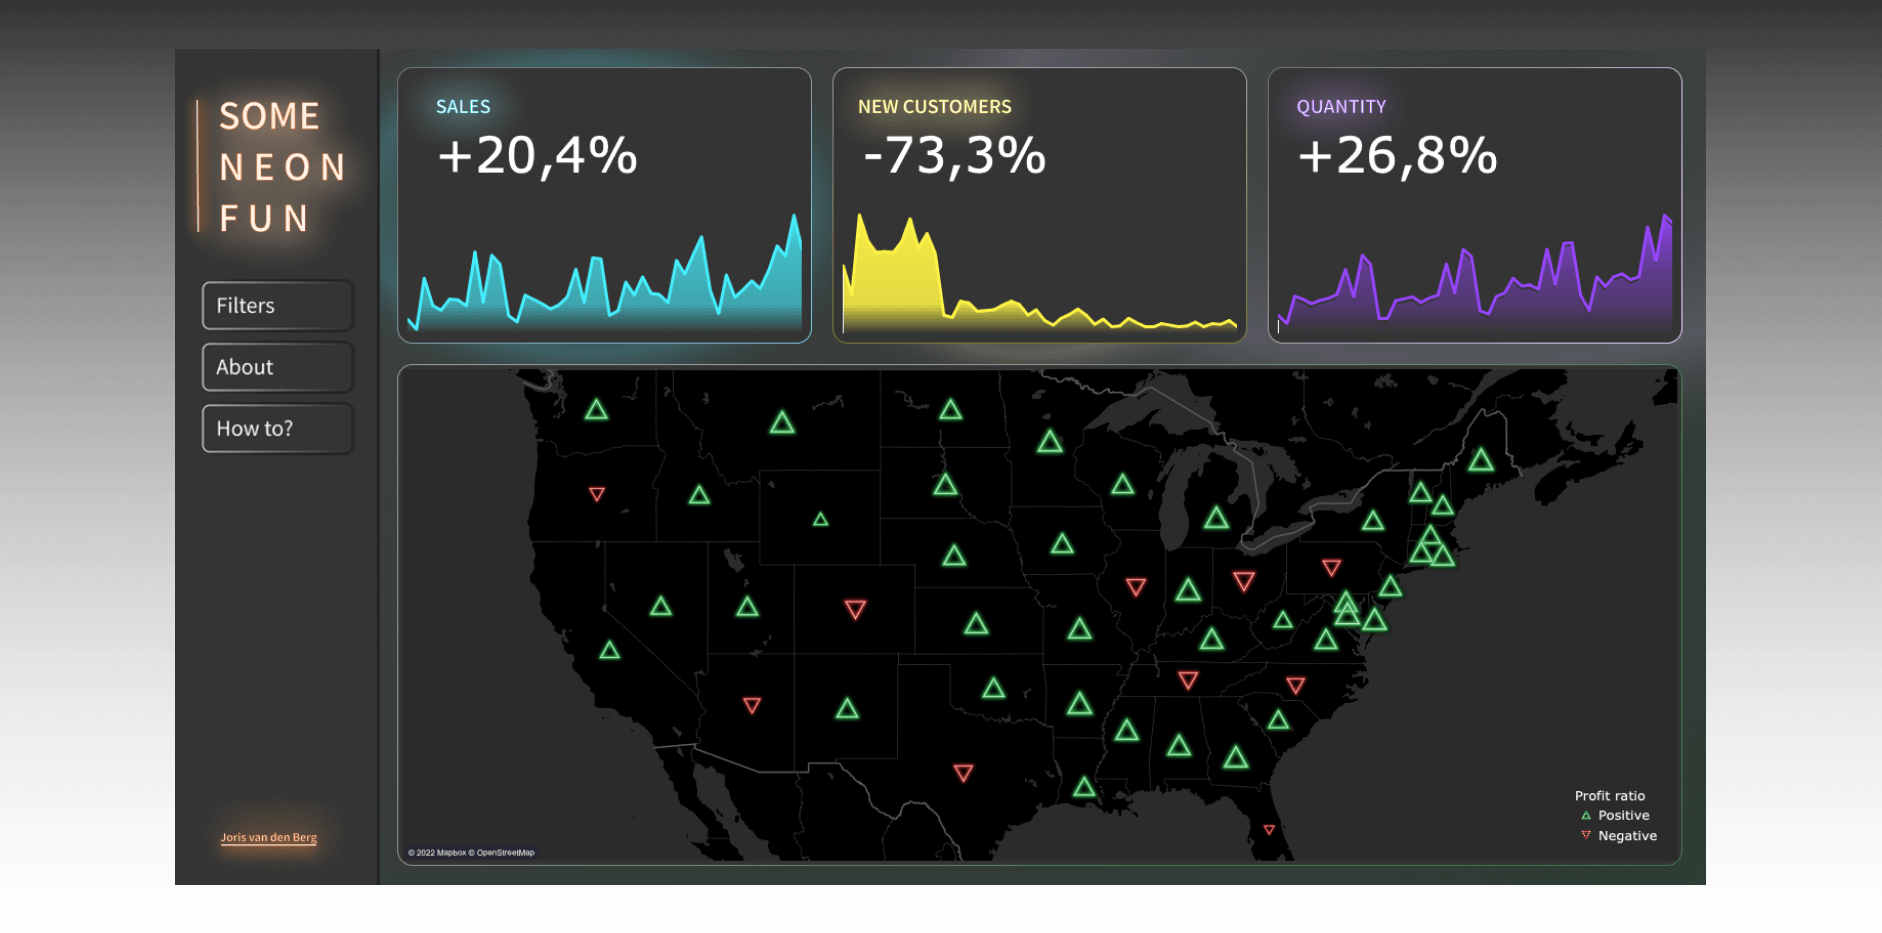
Fan of bright colors? Want something eye-catching in your dashboards? Then look no further! In this blog, I'll explain how to make a dashboard with neon effects...
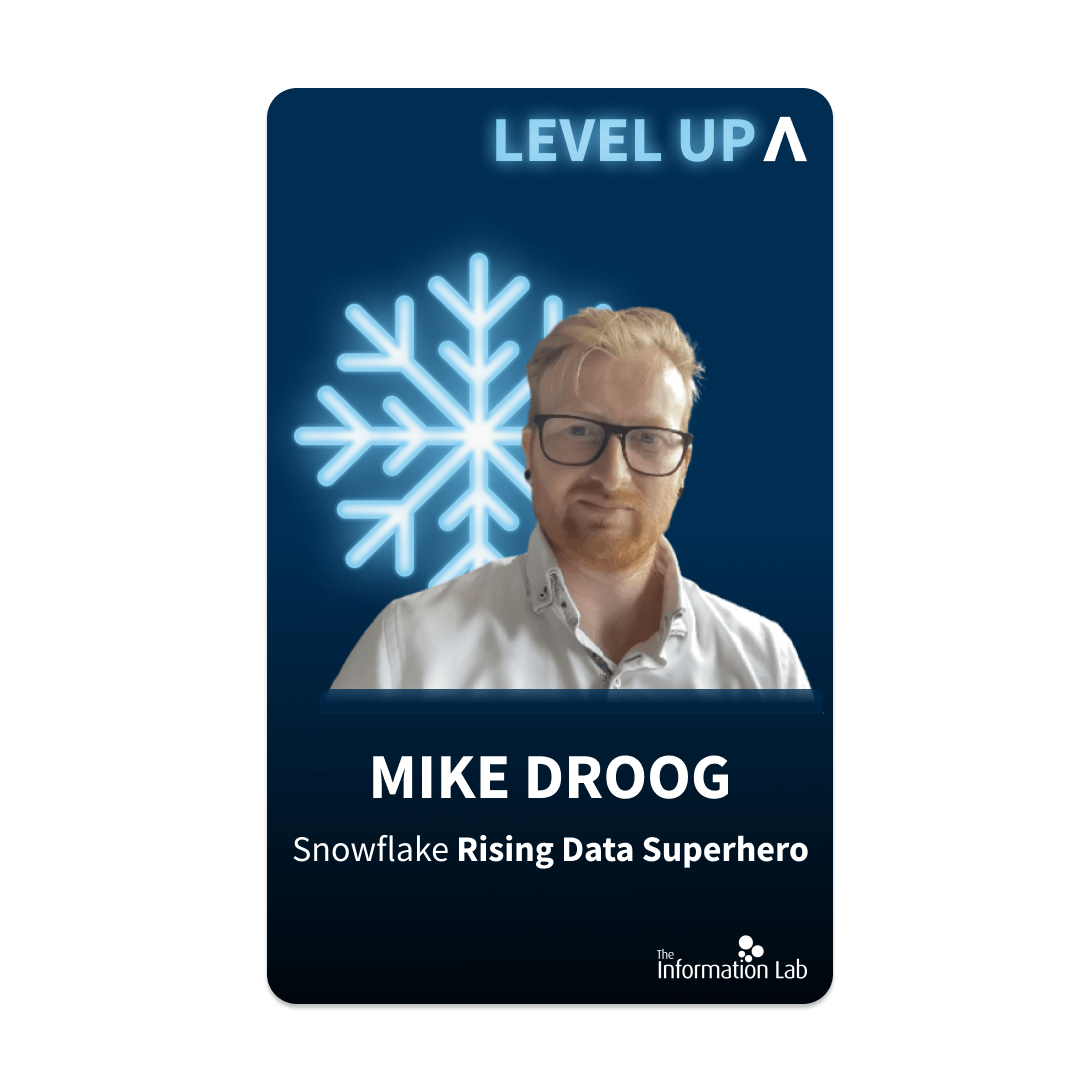
College Mike Droog has been nominated by Snowflake as a Rising Data Superhero (as 1 of 9 suggested candidates!). Super cool and quite an honor, but what exactly is that a...
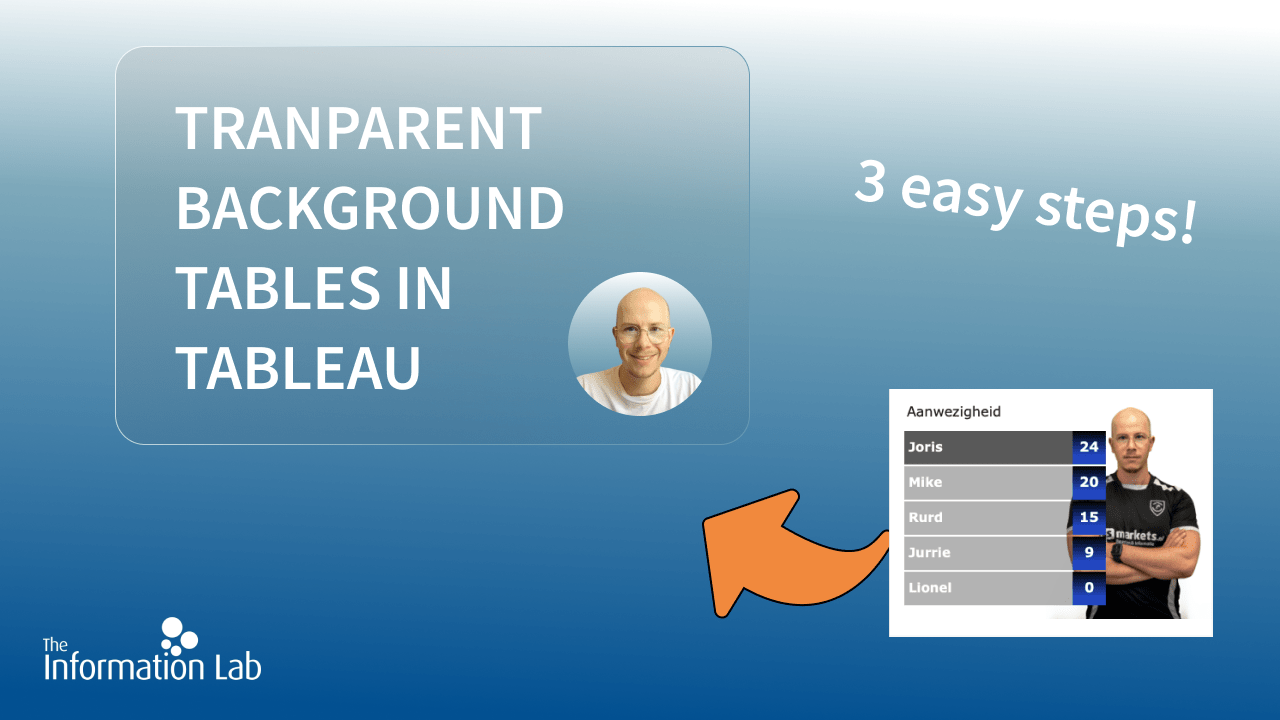
It was quite a thing in 2018: transparent worksheets in Tableau. A cool feature that allows you to superimpose your visualizations over other images. Still, I ran into...

The Women's European Championship 2022 kicked off last week in England. Together with Gracenote, our very own Halftime Heroes have created visualizations on the historical performances and predictions of the participants....
It was my dream as a soccer, Tableau and data enthusiast: a live Premier League Dashboard that updates daily with the latest results. The best matches, results and players automatically...

It's a wrap! The Tableau Conference 2022 (TC22) is over. This year again, a lot of new features have been announced. In this blog I will share my...

It is almost time again: the Tableau Conference 2022! This year Tableau is in a hybrid version. This means that the conference can be followed both live and online....