
When working with Power BI you can very simply use time intelligence functions when making calculations. With SAMEPERIODLASTYEAR() you can quickly calculate a value for the same time period, but one year earlier. And DATESYTD() can be used to calculate a cumulative value to the current date within the same year. So when you combine these two functions, you get the cumulative value to the current date, but one year earlier. This can be useful to, for example, compare the accumulation of the current year's sales figures with those of the previous year. However, if you are dealing with an incomplete year, this can cause problems in your visualizations. This blog will show you how to use LY and YTD calculations in combination with an incomplete year in Power BI.
Calculate YTD and LY YTD
In the following examples, I am going to calculate Net Sales YTD and Net Sales LY YTD using the following code:
Net Sales YTD =
CALCULATE (
[Net Sales],
DATESYTD ( 'Date'[Date] )
)
Net Sales LY YTD =
CALCULATE (
[Net Sales] ,
CALCULATETABLE (
SAMEPERIODLASTYEAR ( 'Date'[Date] ),
DATESYTD ( 'Date'[Date] )
)
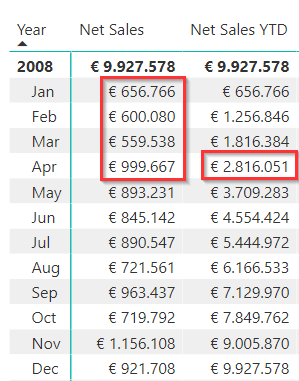
)Below you can see that the Net Sales YTD calculation for April consists of the sum of Net Sales for the months of January through April. In addition, the Net Sales YTD value for December is the same as the total of Net Sales for 2008.
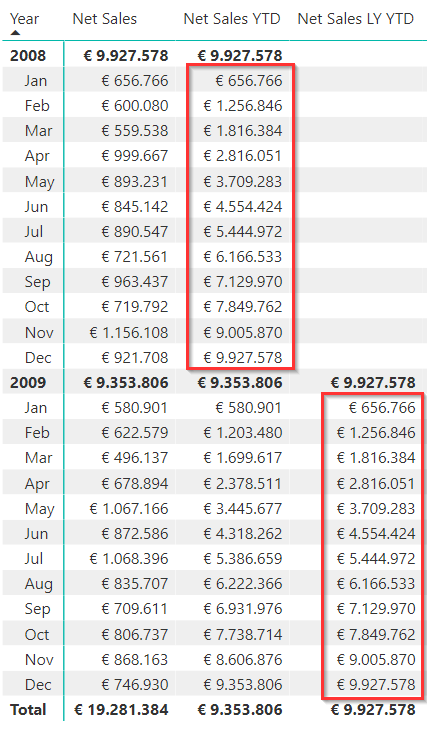
Below are the Net Sales LY YTD. As 2008 is the first year, no values can be displayed for this year. For the year 2009, you can see that the values exactly match the values displayed at Net Sales YTD for 2008. Thus you can see that the total Net Sales is 4.3 million in June 2009, compared to 4.5 million a year earlier.
How to proceed in the case of an incomplete year?
However, when the last year in your visual is not completed, this can cause confusion. To illustrate this, I manipulated the data set. The last date with sales data is now July 14 in 2009. Below you can see the what the visual will look like now.
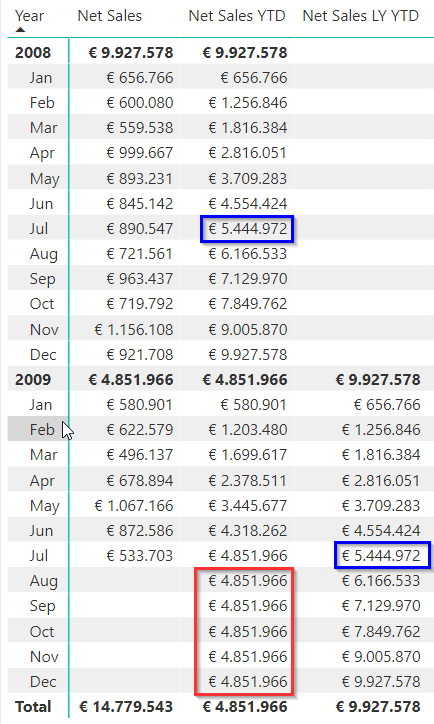
Even though there are now no Net Sales and Net Sales YTD values for the months of August through December, both YTD measures do generate values for the entire year. In addition, the month of July in 2009 is not complete (the data runs to 14-07-2009) while the Net Sales LY YTD for July 2009 does show the full value for a year earlier. So not really a fair comparison. We can solve this in a few steps.
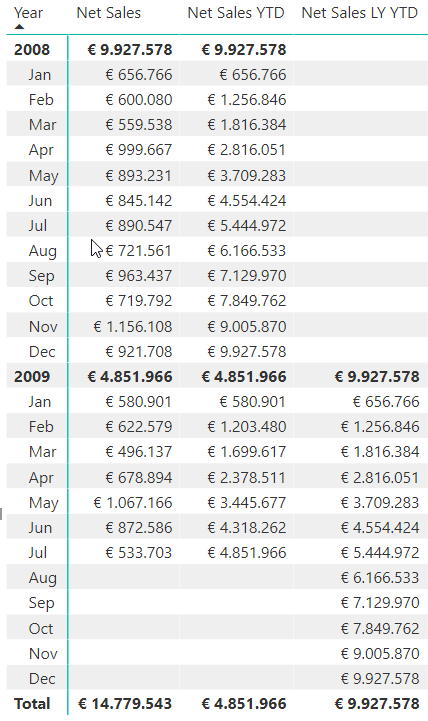
First of all, let's solve the red block. The moment there are no new Net Sales values, I don't need to see the cumulative value either. You could solve this simply by checking if Net Sales are reported in the current filter context:
Net Sales YTD =
IF ([Net Sales],
    CALCULATE(
        [Net Sales],
        DATESYTD( 'Date'[Date] )
    )
)
For the Net Sales LY YTD, I do the same thing, but am going to use variables:
Net Sales LY YTD 2 =
VAR __SalesCheck = [Net Sales]
VAR __Result =
    IF (
        __SalesCheck,
        CALCULATE (
            [Net Sales] ,
            CALCULATETABLE (
                SAMEPERIODLASTYEAR ( 'Date'[Date] ) ,
                DATESYTD ( 'Date'[Date] )
            )
        )
    )
RETURN __Result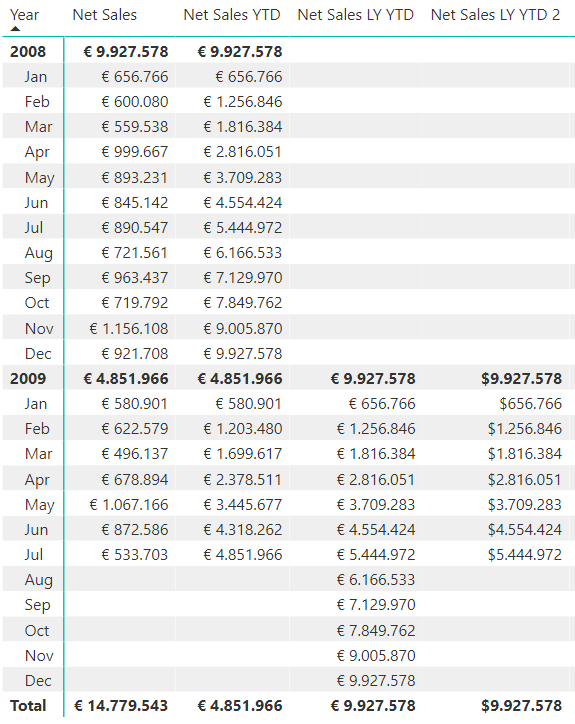
Run LY YTD to last date with Net Sales
Now it is time to address the value of Net Sales LY YTD 2 in July 2009. I would like to see here the YTD from July 2008 to July 14 instead of July 31. This is to allow for a fair comparison. I do this by adding a new variable with the last visible date in the current filter context:
Last Visible Date = MAX ( Sales[Order Date] ) I then pass this variable to the CALCULATETABLE() statement which determines the dates for which Net Sales is calculated. To show how this last visible date works I have temporarily added it to the table:
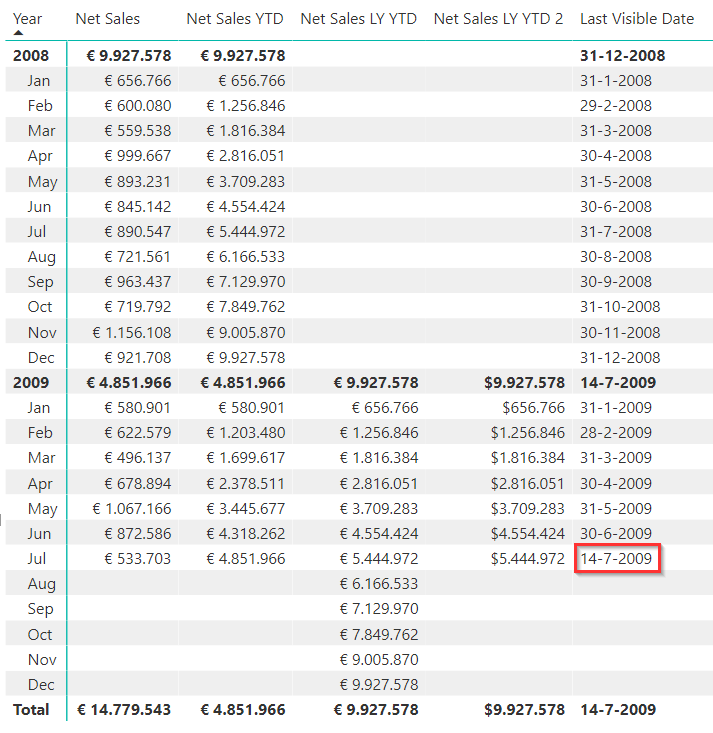
As you can see, the date of 14-7 is displayed correctly in the July 2009 filter context. Time to start using this variable in the formula below:
Net Sales LY YTD 3 =
VAR __LastVisibleDate = MAX ( Sales[Order Date] )
VAR __Result =
    CALCULATE (
        [Net Sales] ,
        CALCULATETABLE (
            SAMEPERIODLASTYEAR ( 'Date'[Date] ) ,
            DATESYTD ( 'Date'[Date] ),
            'Date'[Date] <= __LastVisibleDate
        )
    )
RETURN __Result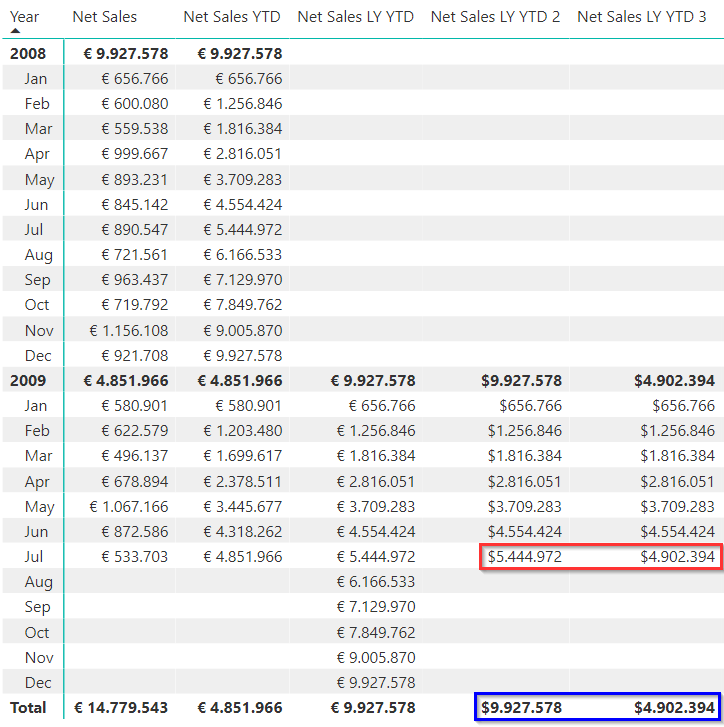
Now Net Sales LY YTD 2 shows the July 2008 YTD through July 14 instead of July 31.
You may have noticed that the previously applied check on Net Sales is no longer present in the formula. Because we now check whether a date in the current filter context is before the last order date, this is no longer necessary. Also the total is now improved. Because the last visible date in the total row is also equal to 14-7-2009, the YTD to 14-07-2008 is now displayed here instead of 31-12-2008.
If you want to remove the total completely, you can make another small adjustment to the formula. I have done this by adding a variable that checks if multiple years are present in the current filter context. In the total row this is the case, namely 2008 and 2009. Then the formula only calculates a value if this is not the case:
Net Sales LY YTD 4 =
VAR __LastVisibleDate = MAX ( Sales[Order Date] )
VAR __NotGrandTotal = HASONEVALUE('Date'[Year])
VAR __Result =
    IF ( __NotGrandTotal ,
        CALCULATE (
            [Net Sales] ,
            CALCULATETABLE (
                SAMEPERIODLASTYEAR ( 'Date'[Date] ) ,
                DATESYTD ( 'Date'[Date] ),
                'Date'[Date] <= __LastVisibleDate
            )
        )
    )
RETURN __Result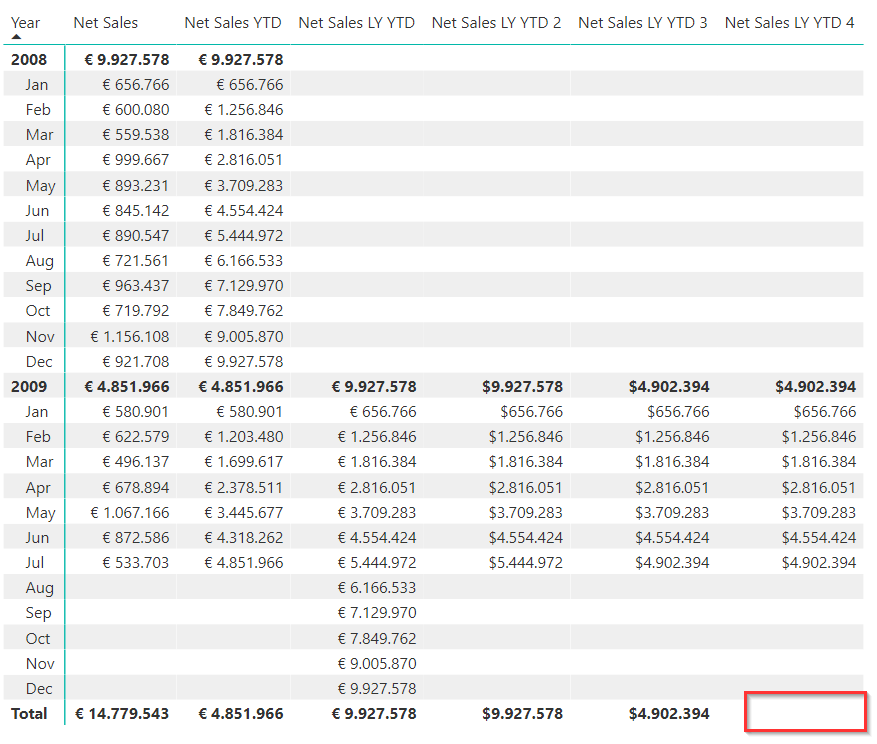
Conclusion
I hope this blog has helped you get a better understanding of how to use YTD and LY calculations in conjunction with an incomplete year in Power BI. Should you be interested in our other blogs you can find them here.