
Datavisualisatie heeft de afgelopen jaren een lange weg afgelegd en de toekomst ziet er nog rooskleuriger uit. Aangezien data in een ongekend tempo blijft groeien, zal het vermogen om deze gegevens effectief te communiceren nog belangrijker worden. Wij hebben 6 trends voor de toekomst van data visualisatie voor je verzameld.
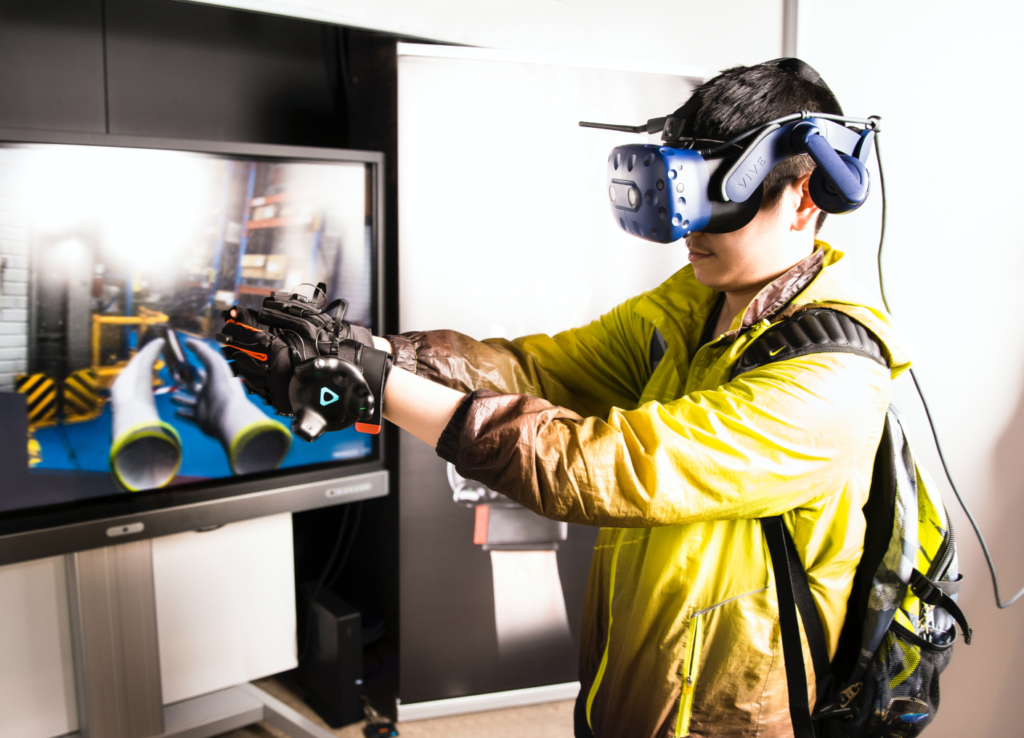
1. Interactiviteit en VR/AR
Met technologische vooruitgang wordt datavisualisatie interactiever en meeslepender. Gebruikers zullen op een meer natuurlijke manier met data kunnen omgaan. Bijvoorbeeld door middel van gebaren of spraakopdrachten. Daarnaast zullen gebruikers zich kunnen onderdompelen in de data via virtual en augmented reality.
2. Door machine learning aangedreven visualisatie
Machine learning zal een steeds belangrijkere rol spelen bij datavisualisatie. Door algoritmen voor machine learning te gebruiken, kunnen visualisatietools automatisch patronen en inzichten in gegevens identificeren. Hierdoor wordt het voor gebruikers makkelijker om nieuwe informatie te ontdekken.
3. Real-time en streaming data
Real-time en streaming data zullen steeds vaker voorkomen en tools voor datavisualisatie zullen deze data in real-time verwerken en weergeven. Hierdoor kunnen gebruikers snellere, beter geïnformeerde beslissingen nemen.
4. Toename gebruik van natuurlijke taal
Naarmate de technologie voor natuurlijke taalverwerking (NLP) verbetert, zal datavisualisatie steeds meer gebruik maken van natuurlijke taal. Hierdoor kunnen gebruikers op een meer natuurlijke manier vragen stellen en met gegevens omgaan, waardoor ze toegankelijker worden voor een breder scala aan gebruikers. Tableau sorteert al voor op deze functionaliteiten met Ask Data. In een wat oudere blog uit 2019 leggen we Ask data aan je uit.
5. Meer maatwerk en personalisatie
in de toekomst zullen datavisualisatietools meer aanpasbaar en gepersonaliseerd worden. Gebruikers kunnen hun visualisaties aanpassen aan hun specifieke behoeften en voorkeuren, waardoor ze gemakkelijker de inzichten kunnen vinden die ze nodig hebben. Ook hier zie je de eerste functionaliteiten al terug in Tableau. Zo kun je met Dynamic Zone Visibility gebruikers zelf in laten stellen wat ze wel/niet in het dashboard willen zien.
6. Meer aandacht voor storytelling en narratieven
Datavisualisatie wordt meer een storytelling-kunstvorm met meer focus op het creëren van narratieven en verhalen rondom data. Hierdoor kunnen gebruikers inzichten beter begrijpen en onthouden en effectievere beslissingen nemen. Makers van deze dashboards nemen gebruikers bij de hand en leiden ze door een verhaal heen. Sinds Tableau versie 2022.4 is de functie ‘Data stories’ in het leven geroepen voor deze ontwikkeling. Tableau maakt dat automatisch een stuk verhalende tekst die bevindingen uit het dashboard omschrijft.
Over het algemeen wordt verwacht dat de toekomst van data visualisatie interactiever, meeslepender en meer op maat wordt gemaakt voor individuele behoeften. Met de voortdurende groei van data en technologische vooruitgang, zal datavisualisatie een steeds belangrijkere rol spelen bij het helpen van organisaties om hun data te begrijpen en betere beslissingen te nemen.