Het kan soms handig zijn om een dynamische crosstab of tabel te hebben waarbij je kunt schakelen tussen dimensies én table calculations. Het probleem is alleen dat de table calculation dan in de war kan raken. Wanneer je bijvoorbeeld het percentage horizontaal (across/over de regel) of verticaal (down/over de kolom) opgeteld wilt zien worden zijn twee table calculations nodig. “Kun je eigenlijk wel schakelen tussen measures als table calculations in Tableau?” vroeg ik me dus af.
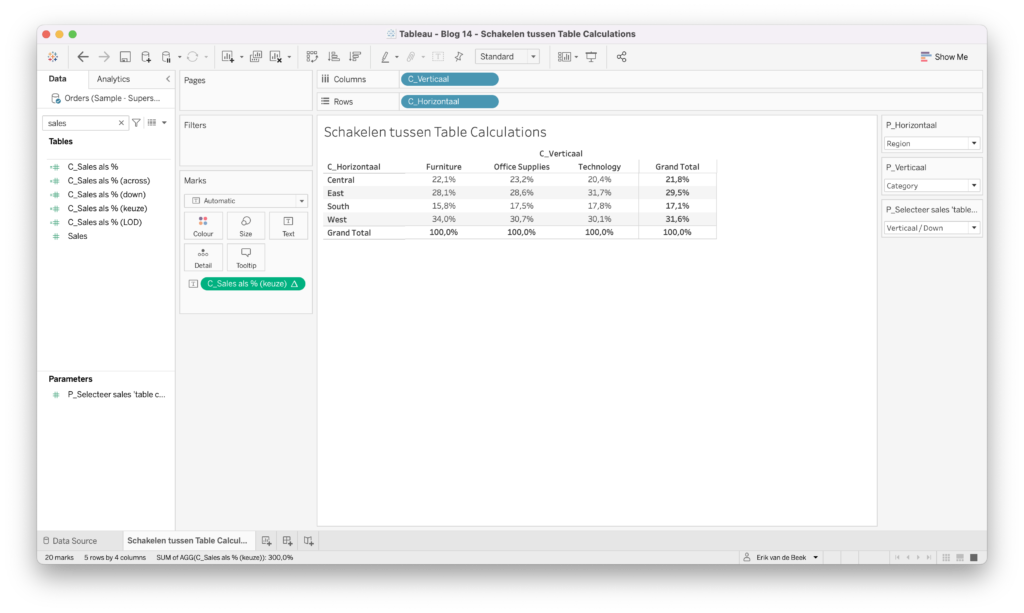
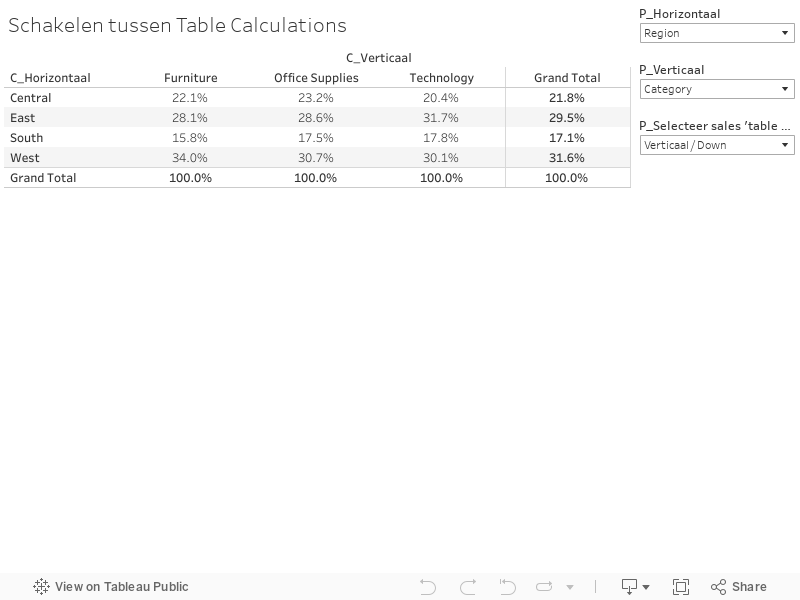
Nu kwam ik er bij een klant achter dat dit in Tableau gewoon met een parameter op te lossen valt. De klant wilde graag dat de gebruiker zelf de dimensies voor row/regel en column/kolom kon kiezen. Het idee was dat verschillende kwalitatieve eigenschappen tegen elkaar afgezet konden worden. Als klap op de vuurpijl is het met een LOD ook mogelijk om rekening te houden met iets als ‘percentage van het geheel’ . Hieronder ziet u het eindresultaat, hierna zal ik uitleggen hoe dat zit:
Schakelen tussen dimensies
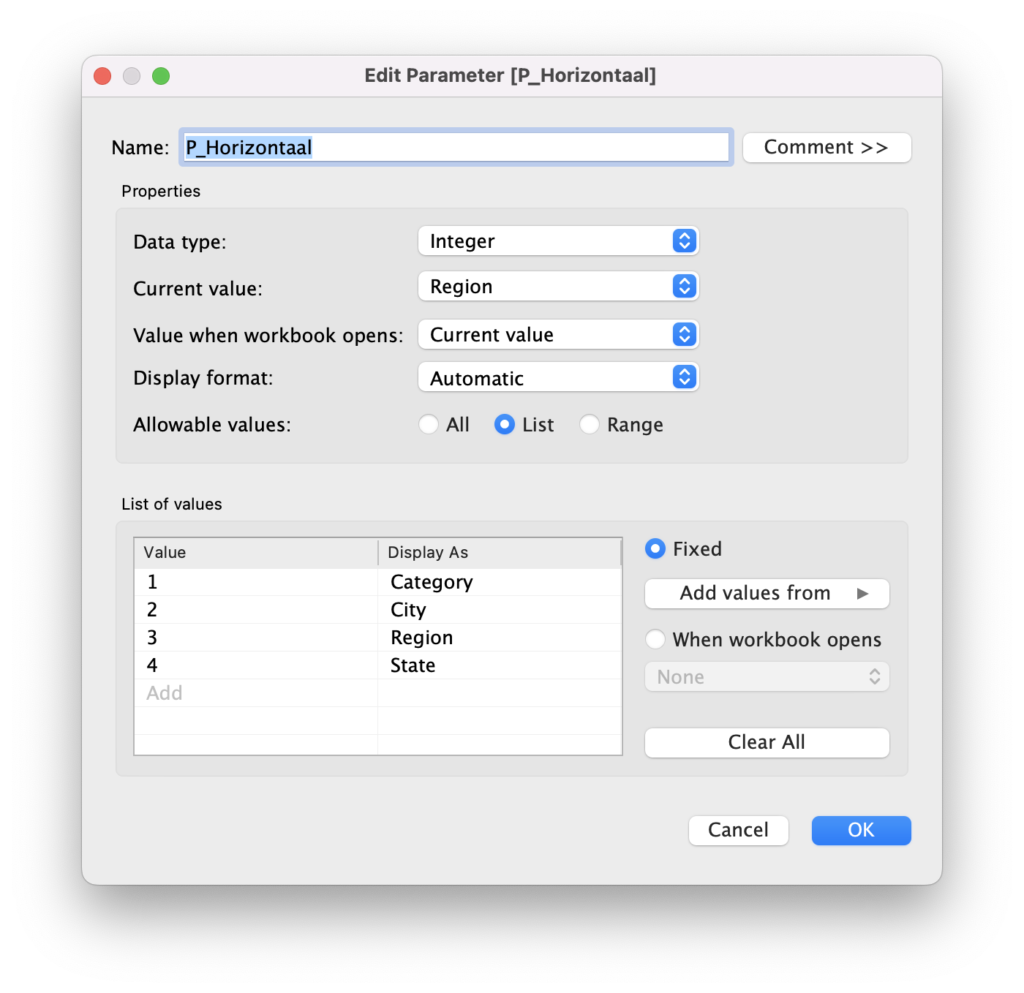
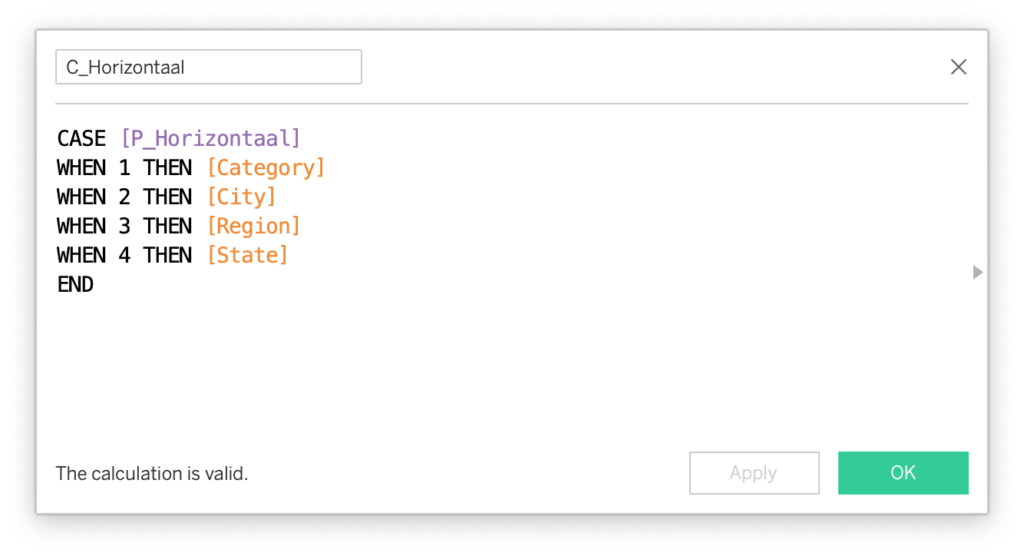
Allereerst maakt u een parameter om te schakelen tussen dimensies en een bijbehorende calculatie. De calculatie zet u op rows.
Vervolgens herhaalt u de bovenstaande stap om dezelfde parameter en calculatie te maken voor verticaal of columns. Vervolgens zet u C_Horizontaal op rows en C_Verticaal op columns, zet ook de bijbehorend parameters op zichtbaar.
Schakelen tussen measures als table calculations
Deze stap kan soms niet werken, het gaat erom dat u de measures vanuit de marks pane naar de calculatie sleept. Op die manier behoudt Tableau de instellingen voor richting van de table calculation (across of down). Zelf moest ik dit ook een paar keer doen bij het maken van dit blog omdat ik heel eigenwijs gewoon de calculatie opschreef in plaats van sleepte. (Als u niet weet wat een marks pane is, dat is het blok tussen de data en het canvas, onder het blok ‘Filters’).
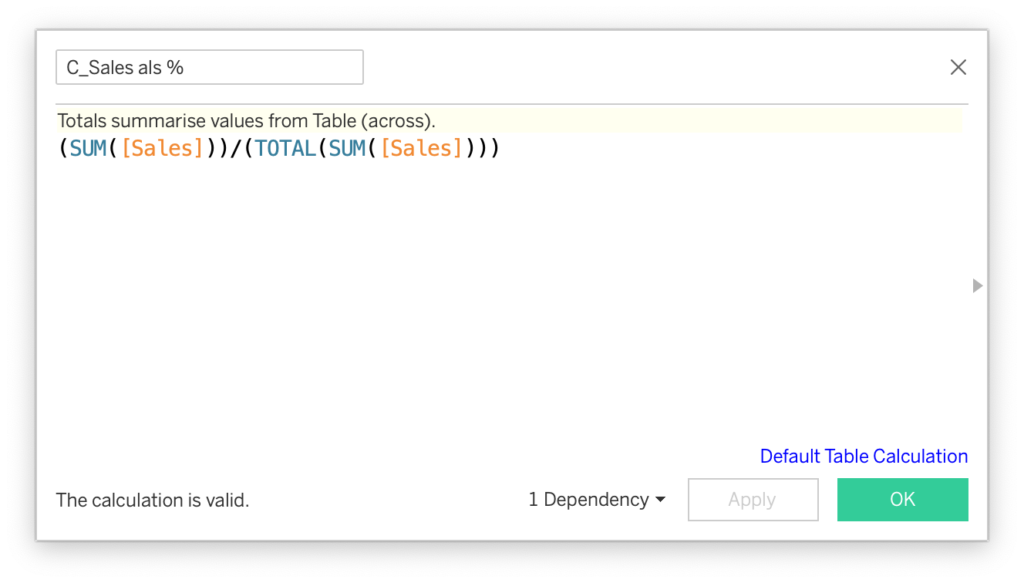
Om de switch tussen table calculations percentage en LOD te maken zijn wat parameters en calculaties nodig. Eerst de calculatie voor ‘Sales als %’ zoals onderstaand:
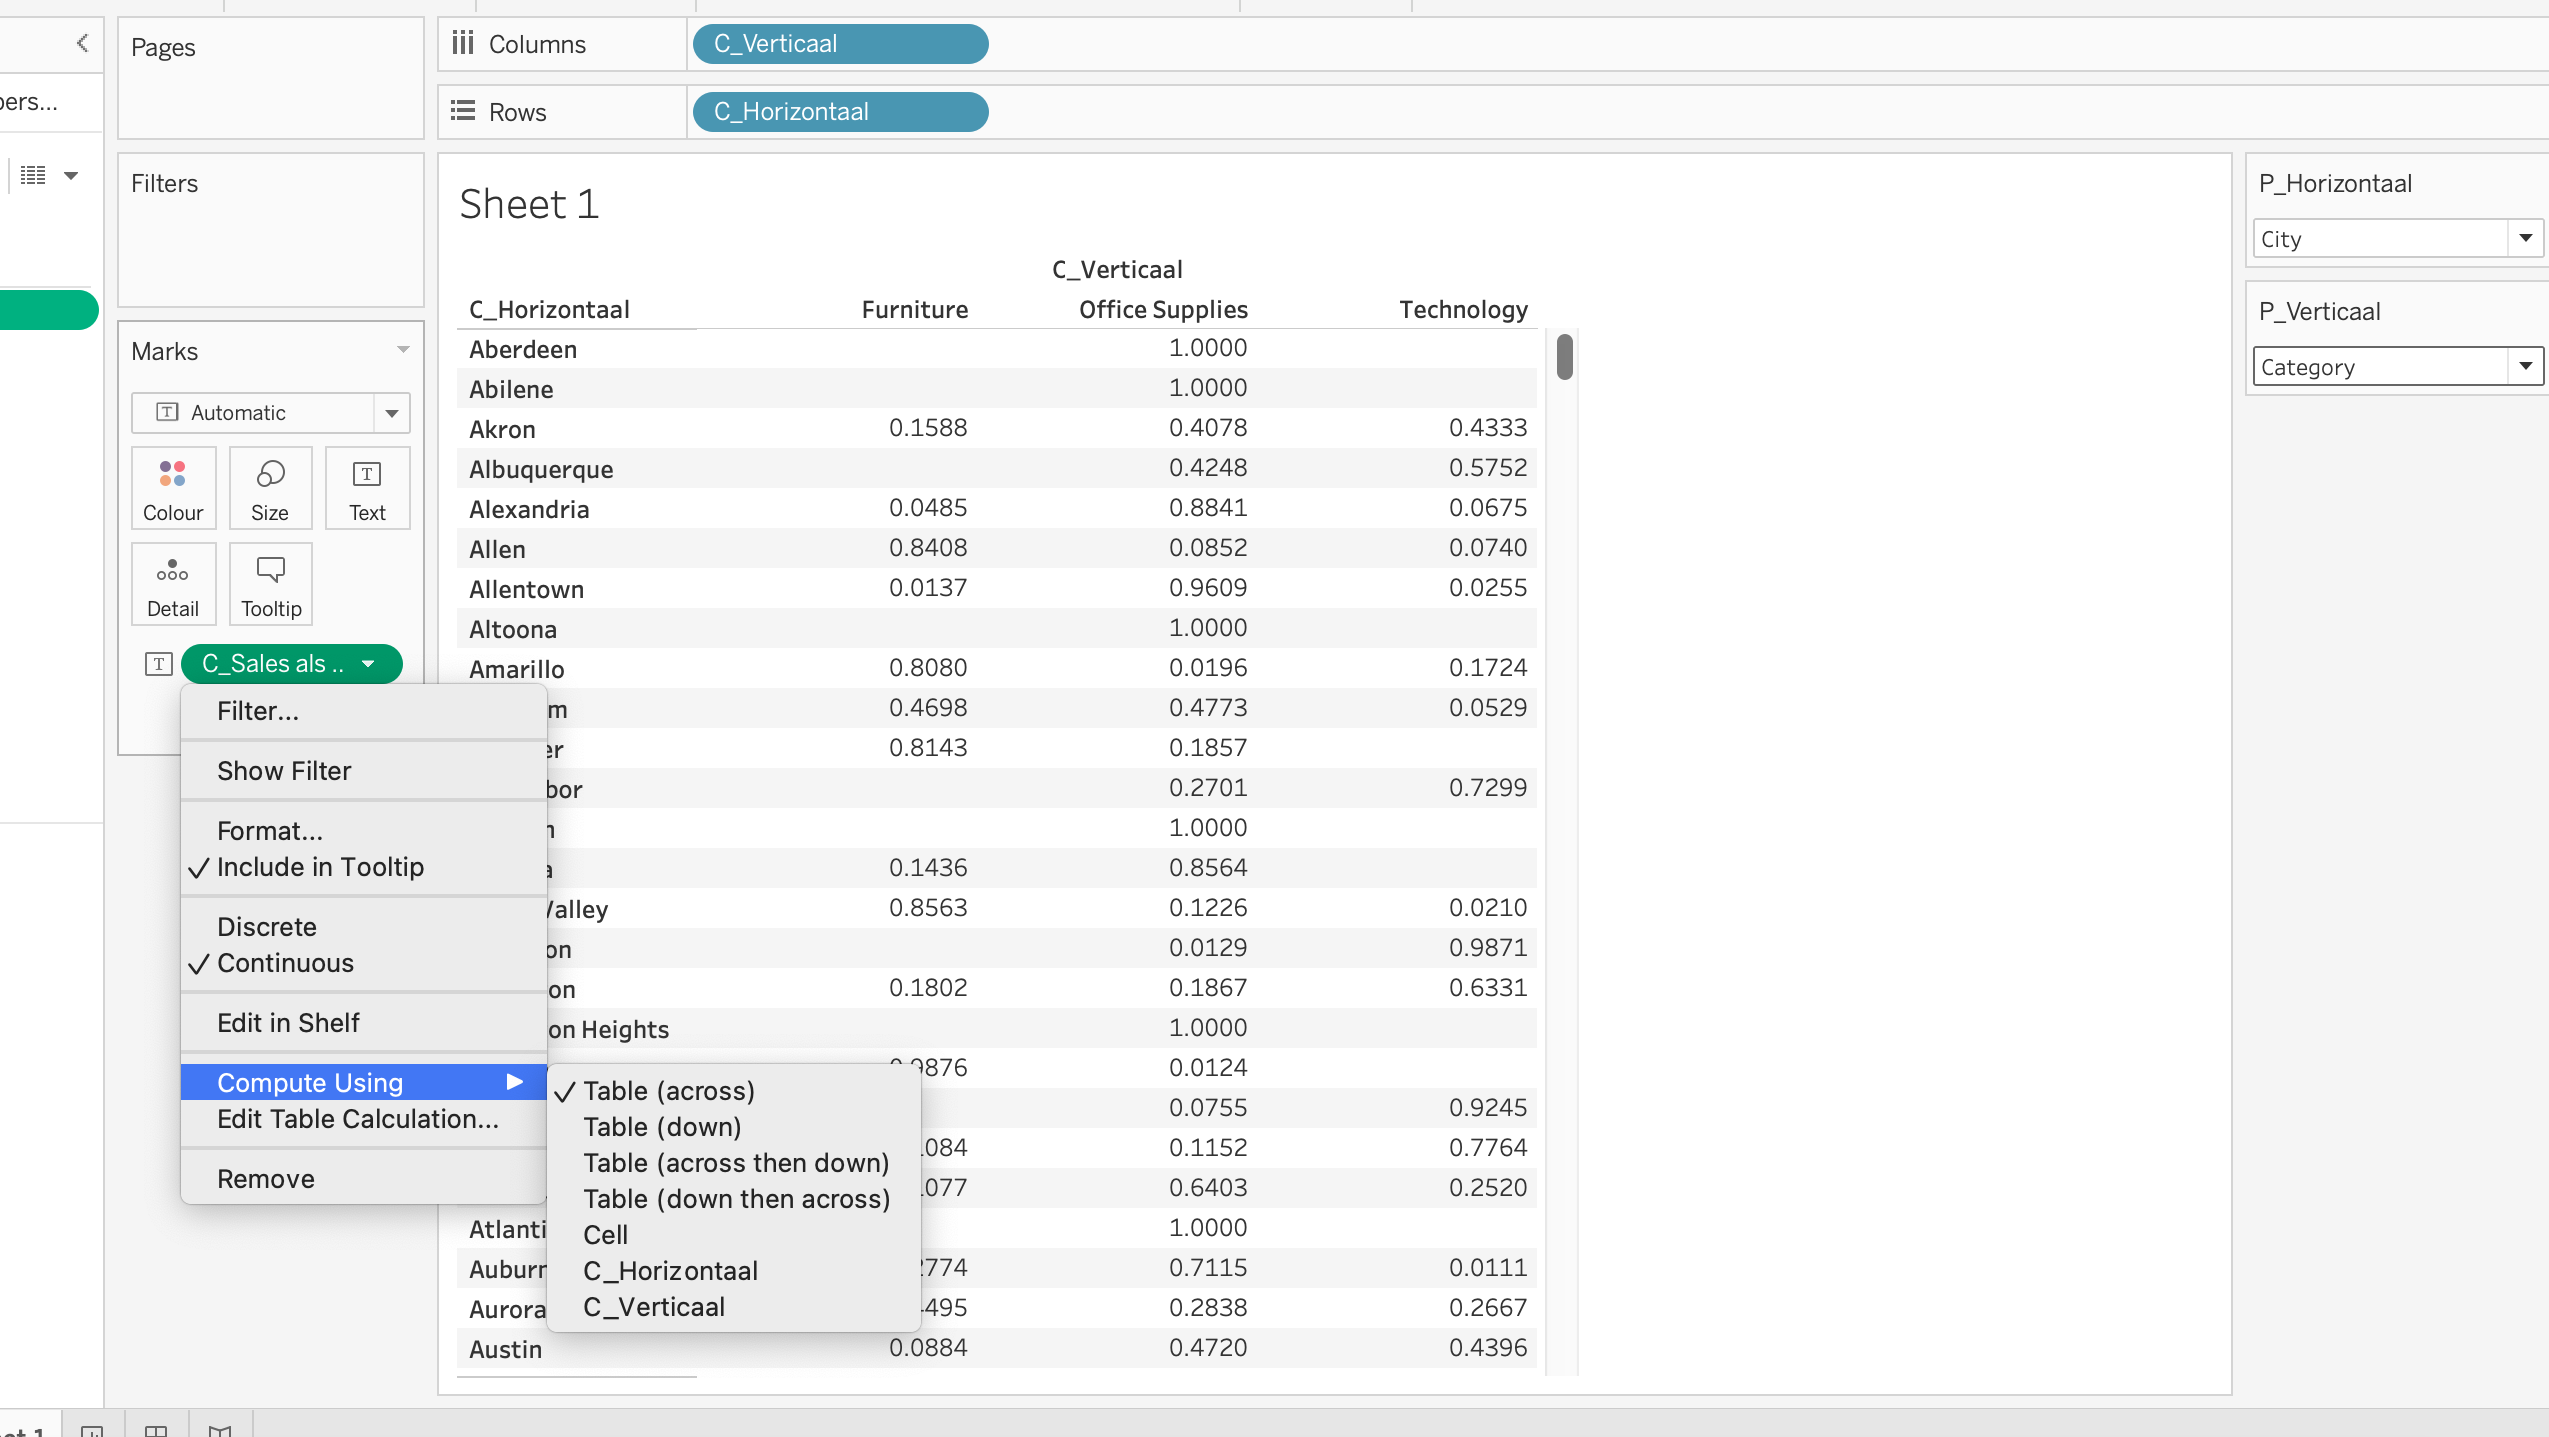
Deze basis dupliceerde ik als ‘C_Sales als % (across)’ en ‘C_Sales als % (down)’. De veranderingen vinden pas plaats in het Marks Pane. Sleep ‘C_Sales als % (across)’ in de marks pane, vervolgens selecteert u onder ‘Compute Using: Table (across)’. Bij ‘C_Sales als % (down)’ herhaalt u deze stap maar selecteert u ‘Compute Using: Table (down)’.
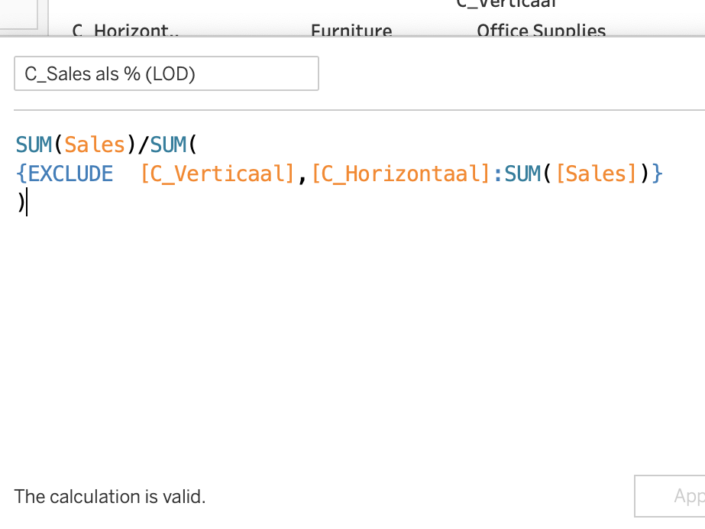
Vervolgens maakt u de onderstaande calculatie voor de LOD:
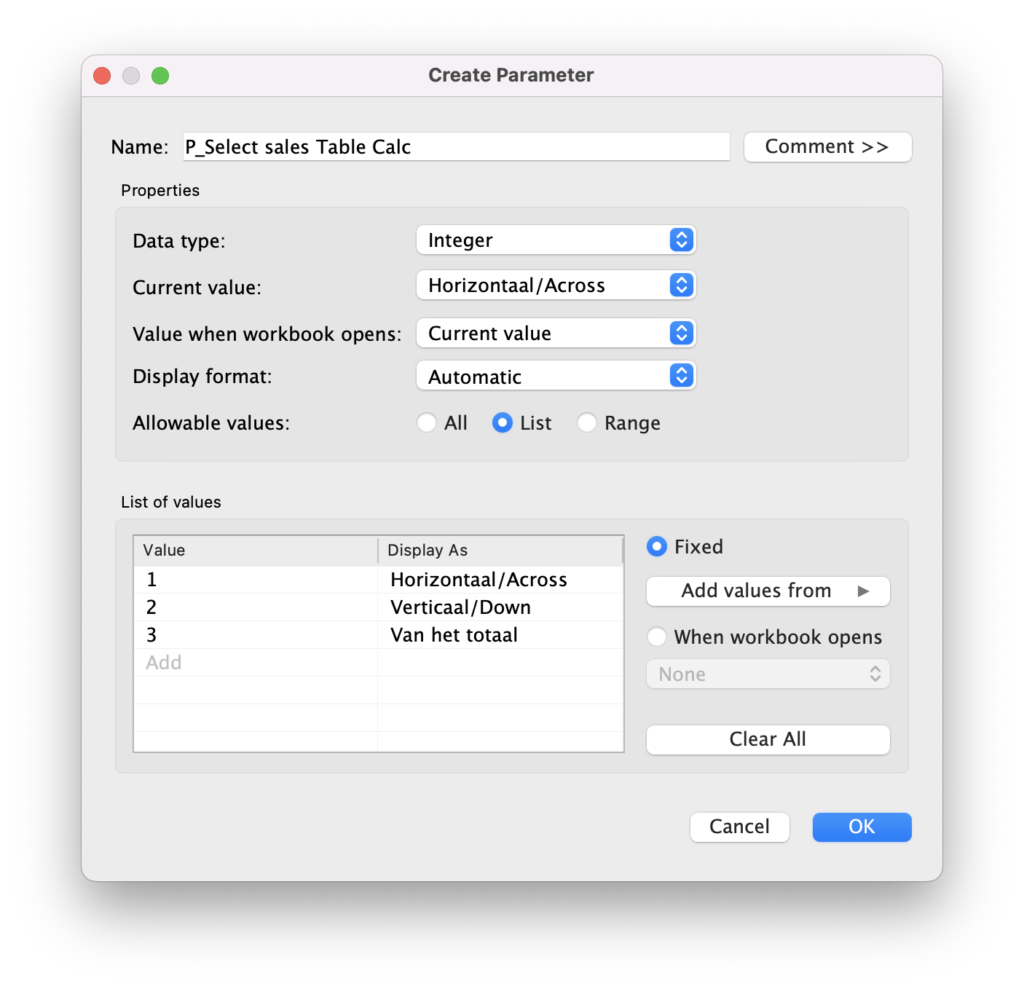
Nu kunt de parameter en calculatie maken om te schakelen tussen de measures, zie onderstaand. Eerst maakt u de parameter en vervolgens de calculatie. LET OP. De calculatie maakt u door de ‘pillen’ of measures in het calculatieveld te slepen, niet door ze te typen:
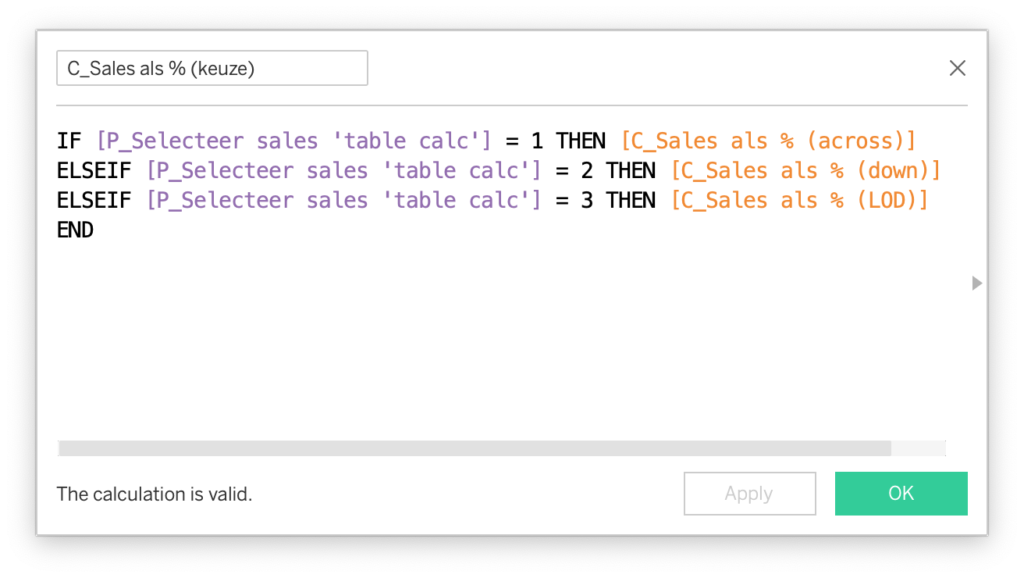
Mocht het niet werken, dan kan het nuttig zijn om de calculaties voor across en down te herschrijven. Ze vervolgens weer in de view te brengen en te kijken of ze across/down rekenen. (En het slepen van de pillen ook te herhalen).
Het moet er uiteindelijk zo uitzien.
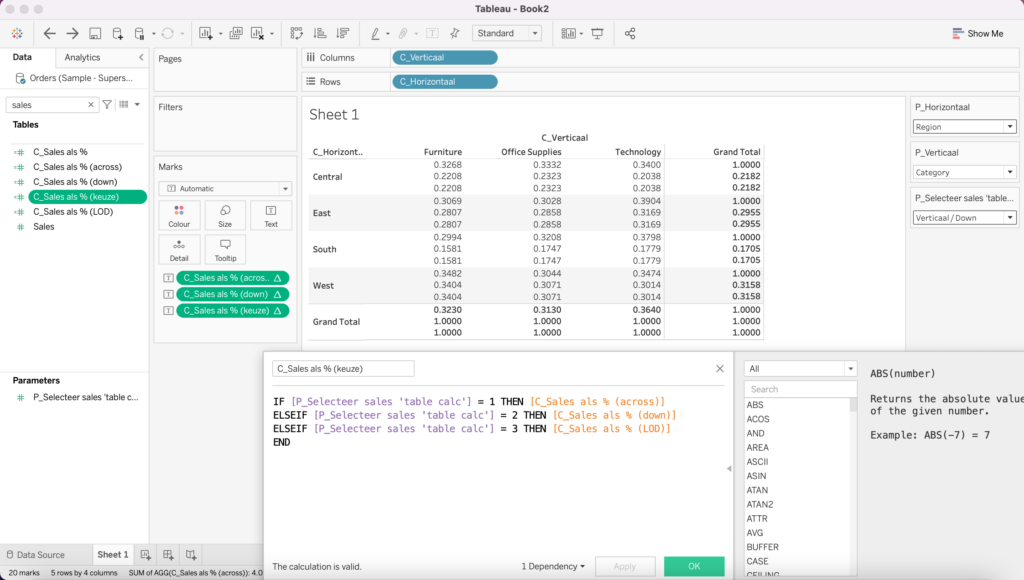
Uiteindelijk moet het worksheet er zo uit komen te zien als in de onderstaande afbeelding. Aan het begin van dit blog kon u al het dashboard zien, via deze link kunt het op Tableau Public vinden. Als u meer wilt leren over table calculations is dit blog van mijn collega Jessica ook aan te raden.