
Predictive Analytics using Machine Learning Algorithms
Part 1: Selecting and preparing your data
Welcome to the first blog of this predictive data analytics and machine learning series. During this blog I will be taking you through how to kick off your predictive project. Throughout, I will show examples from a previous project that I carried out during my time as an intern. Like any data analytic project, the crucial first steps are selecting the correct data and then preparing it ready for analysis.
Type of data
Before we input our data, we must know what kind of data we are looking for. To do this you need to know your independent and dependent variable(s). The independent variables, also known as features, are used to predict the value of the dependent variable, also known as the target or label. My project investigated the effects of weather on automotive breakdowns in Amsterdam. So, the number of automotive breakdowns and incidents is the dependent variable and the multiple weather parameters are the independent variables. These include, temperature, precipitation, and wind conditions. The independent variables represent the input to the model, and the dependent variable represents the output. Essentially, the dependent variable is what we want to predict. Whereas, the independent variable provides the information or context to make that prediction.
Inputting your data
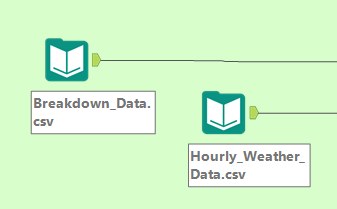
Now that we have identified our dependent and independent variables, we need to import our data. To import your data, you can use the Data Input tool. It lets you connect to a variety of sources, such as Excel files, databases, and cloud storage. In the image below you can see I used two input tools to add weather data (independent variable) and historical accident data (dependent variable).
Data cleansing/formatting
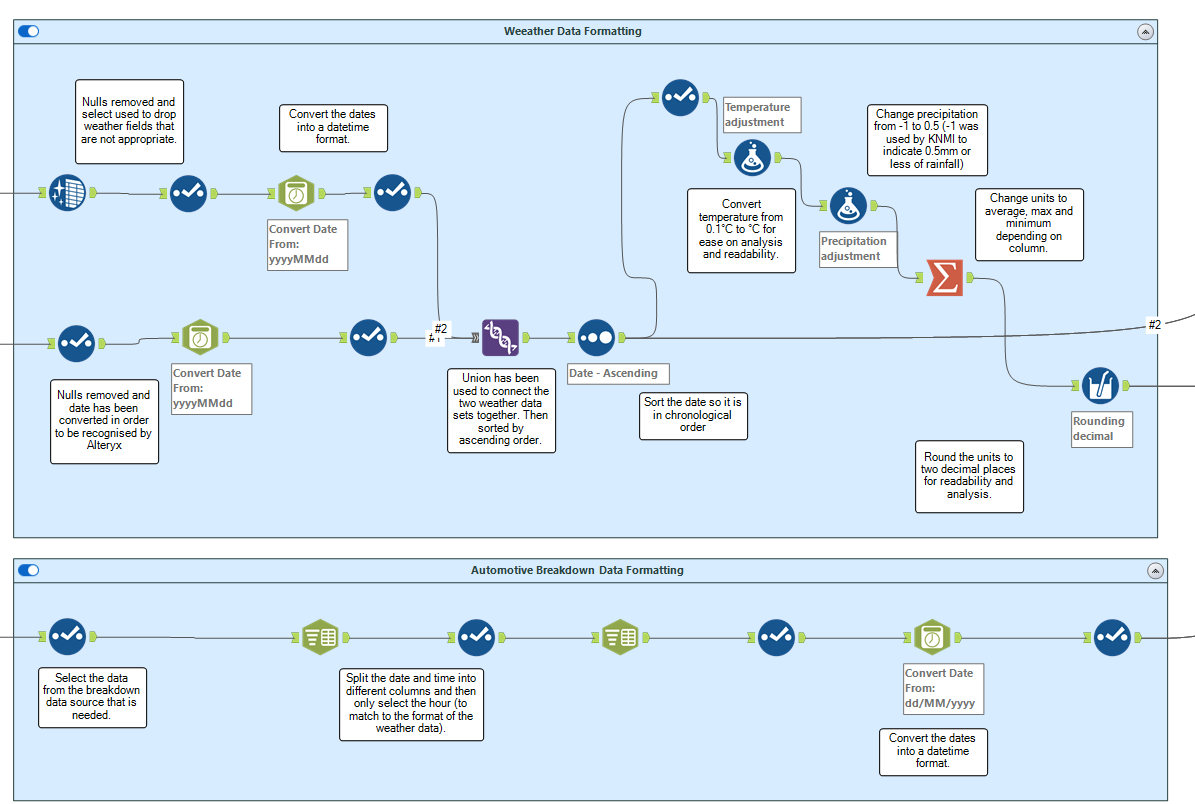
To further prepare your data, you can use multiple tools provided by Alteryx. Look in the ‘Preparation’, ‘Parse’, and ‘Transform’ tabs. By taking time to do this right, you’ll make sure that your predictions at the end of this process are accurate and reliable. In my workflow, you can see examples of cleaning and formatting. I have used the data cleansing tool to remove nulls, datetime tool to correct parsing errors with date and time values, formula tools to update values, filters to remove unwanted data, along with summarise tools to group and manipulate data.
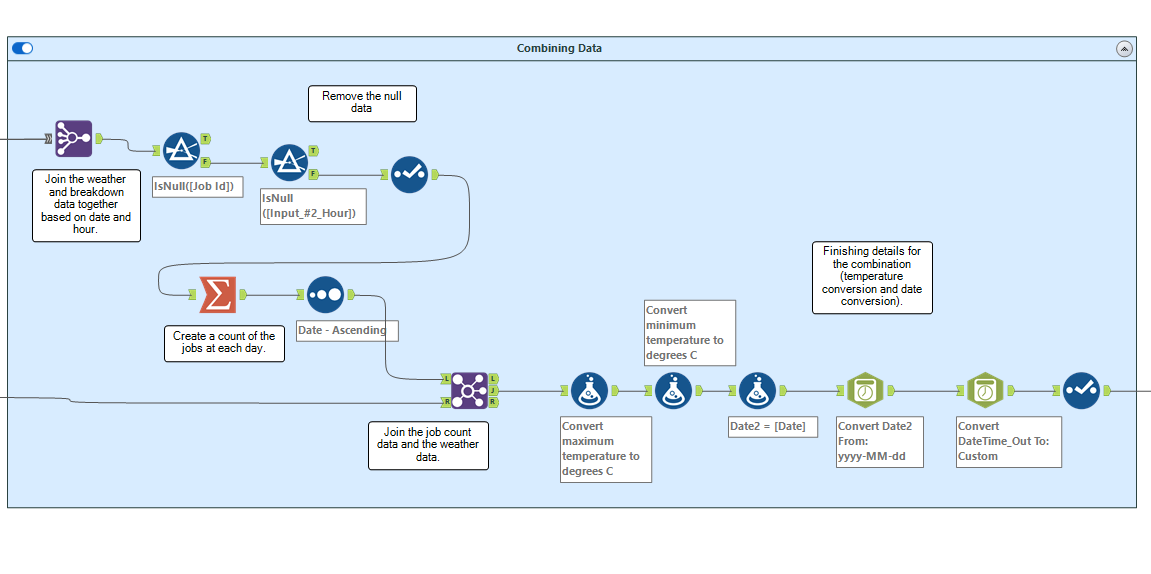
After this, the majority of the cleaning of the data is done. Now, we want to combine the datasets using a join tool. You want to join based on a common field between your independent and dependent variables. If we want to predict the future, we must find correlations from the past. In my example, we are looking at the influence weather has on breakdowns, so they are related by time. Therefore, I joined the datasets together based on the date.
Standardisation
Another important step in getting your data ready for machine learning and predictive analytics is standardisation. It is the process of transforming data into a common format that allows for easier interpretation and comparability. We use standardisation in data to reduce potential biases, simplify the data, and ensure that it is in the right format for the algorithm, making the results more dependable and easier to understand. There are multiple ways of standardising your data, including decimal scaling, Max-Abs scaling, and Min-Max scaling. In my project I used Min-Max scaling.
This scales the data between 0 and 1 to bring all features to the same scale. This reduces the effect of outliers and allows the correlations to be configured and interpreted more easily. If you want to know about standardisation and normalisation in more detail take a look at this Alteryx Community post where there it is explored in more detail along with a workflow demo attached at the end: https://community.alteryx.com/t5/Data-Science/Normalization-Standardization-and-Regularization-in-Alteryx-and/ba-p/733996.
Training and Testing data
When it comes to machine learning, you’ll typically use a training set (a subset of the data) to train the model and a test set (another subset) to evaluate the model’s performance. A common way of dividing your data is the 80/20 split – where 80% of the data is used for training, and 20% for testing. This provides a good balance between building a solid model and evaluating its performance. We use more data to train the model, as we are trying to give the machine the most amount of data to learn from. Once we have done this we can test the model using the other 20% that the model has not seen before and this allows us to really understand whether the model is accurate or not.
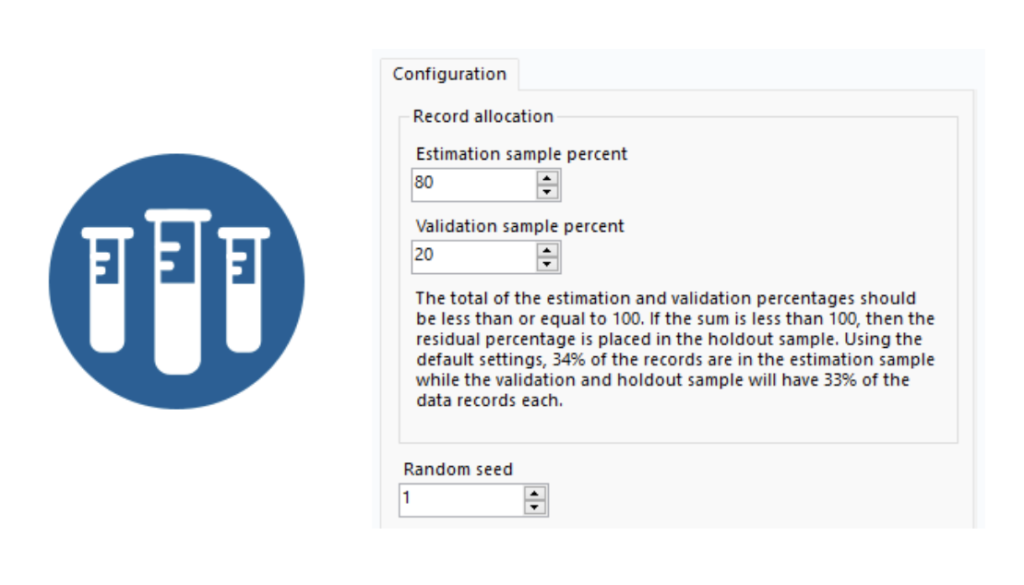
To perform an 80/20 split in Alteryx Designer, you can use the Sample tool. By specifying the percentage of data you want in the estimation sample set (80%) and the percentage of data you want to put into your validation sample set (20%). It’s that simple! You can then use the output from the Sample tool as input for your machine learning model.
Final Thoughts:
In this blog we have delved into how to go about embarking on a predictive analytics project, using Alteryx Designer. Specifically, we have looked at the critical steps involved in starting a successful predictive project. This included the selection of appropriate data, its preparation for analysis, standardisation, and partitioning into training and testing datasets. Next time, we will look into how you can choose the correct machine learning algorithm to get the most accurate results, which again will be posted on our blog section on the website which you can find here: https://theinformationlab.nl/en/blogs/.
See you then!