
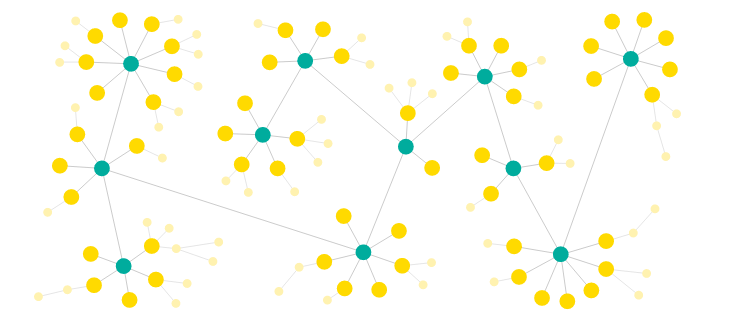
A network graph (also known as a link chart, a node-link diagram, a network map, or just a graph) represents a collection of interlinked entities. This type of graph aims to show the interconnections between this set of entities. Each entity is represented by a Node (or vertice). Connections between nodes are represented through links (or edges).
Network graphs are relevant to any project where the number of connections is high and the interactions between their elements are ambiguous or unknown.
In Tableau, this kind of network graph is possible to build, but usually, it is time-consuming and quite complex. Today I will explain the easiest and fastest way to achieve one. Plus, it will have the inclusion of dynamic iterations for design purposes.
The secret to creating this type of graph in a quick manner comes by using a tool made by fellow Data Visualization expert Tristan Guillevin. His website https://tools.ladataviz.com/ offers a variety of graphs that you can now easily create on Tableau. And here I will explain all the steps that you would need to understand the network graph and take advantage of it.
The main steps that you need for this visualization are split into 3, plus a final optional 1, and each one will be explained below.
General Steps
1. Upload a JSON file into the tool
2. Play with the parameters of your network graph
3. Download your Tableau file
4. (Optional) Tweak the finishing details on your Tableau Dashboard
Upload a JSON file into the tool
To help you create your visualization the tool needs a text file with the data that you would like to visualize. This text file should be of type JSON and needs to contain all the elements necessary for a network graph.
The elements of a network graph are basically 2: nodes and links.
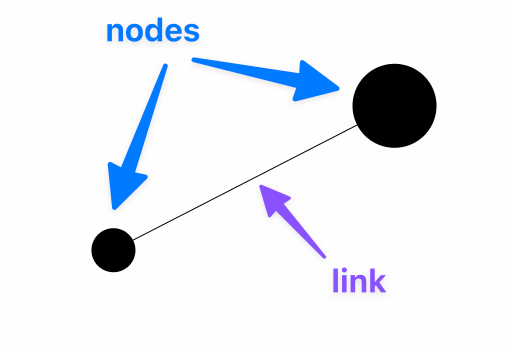
The nodes are the elements that you want to analyze that are connected to each other.
Every node should have an id (which can be of any type, like a string or integer). And every id should be unique.
The links are the representation of the connection or interaction between two nodes. Every and each link should always contain only 1 source and only 1 target.
The source and the target should always be filled with the node’s id.
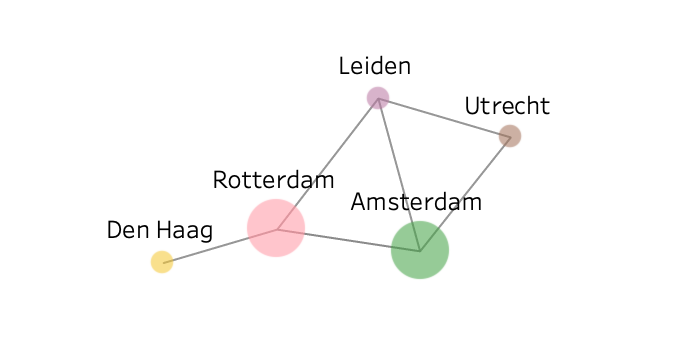
To make these elements clear, an example of this representation would be the train rail system. The nodes of this system will be the train stations, and the links will be trains that connect those train stations.
So your text file should look something like the following:
{
  "nodes": [
    { "id": "Amsterdam" },
    { "id": "Rotterdam" },
    { "id": "Utrecht" }
  ],
  "links": [
    { "source": "Amsterdam", "target": "Utrecht" },
    { "source": "Amsterdam", "target": "Rotterdam" },
    { "source": "Rotterdam", "target": "Utrecht"}
  ]
}
You can look at another example of a network graph input file at https://tools.ladataviz.com/network/network.json
Once you have created the text file, you simply need to save it as a .json extension and upload it into the tool at https://tools.ladataviz.com/network# on the Configuration panel.
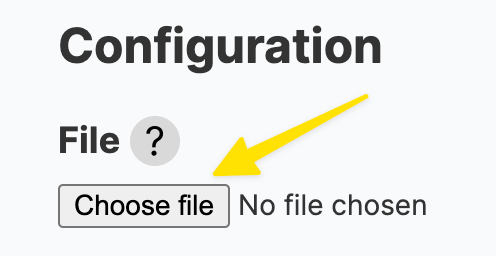
By uploading this JSON file your initial network graph will appear on the visualization panel on the right-side panel.
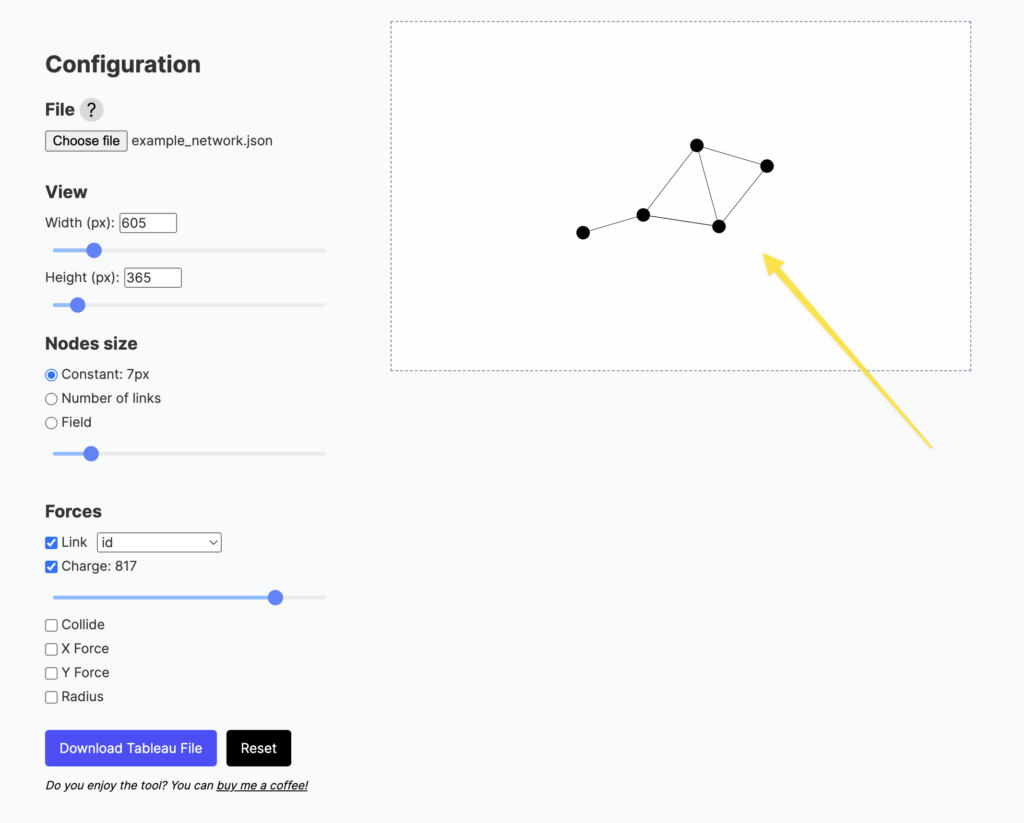
Play with the parameters of your network graph
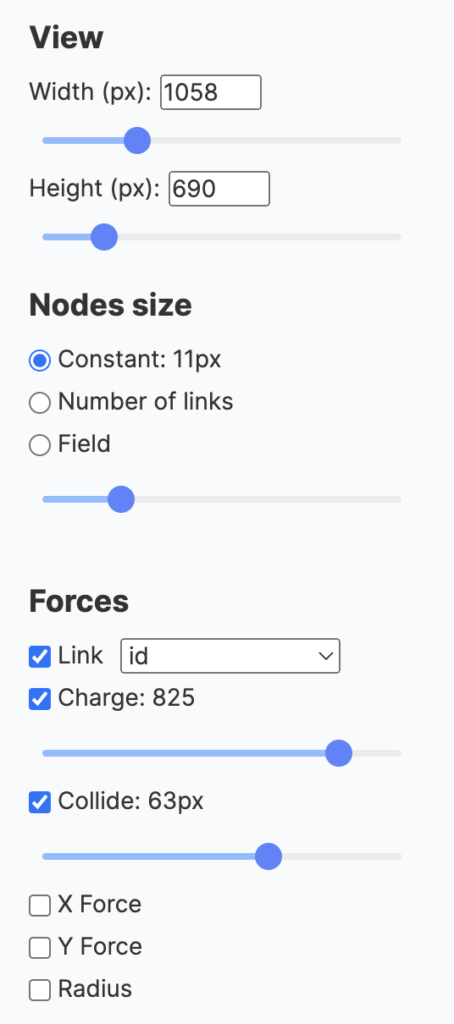
In this section, once you are inside the tool and your data is uploaded you have the freedom to play with all the parameters and variables available.
Every time a parameter is changed, an element in your visualization will change and it will be reflected instantly.
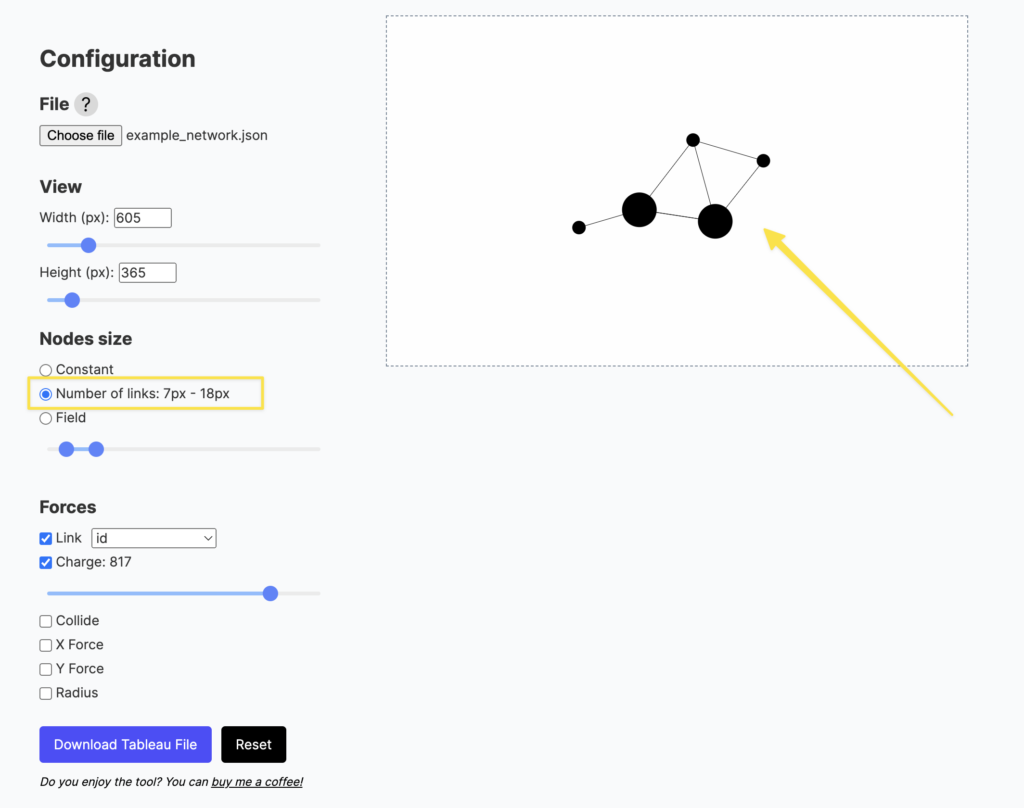
These parameters can be used to tell a more compelling story or to make your visualization more pleasing.
Make sure to play with them until you are happy with the look of your network graph!
Download your Tableau file
Once you are happy with the look of your network graph the last step will be to click on the left-hand bottom button of the page that says Download Tableau File.
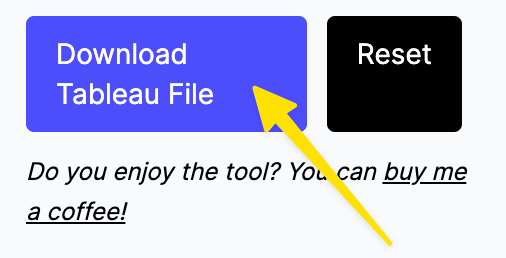
Once you click the button the tool will automatically download the exact image you created as a Tableau dashboard in a packaged workbook file.
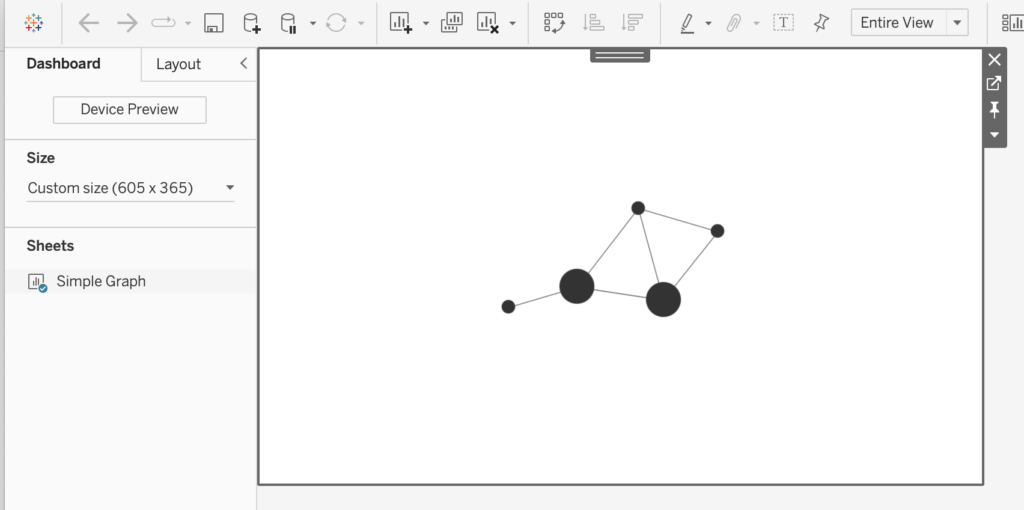
(Optional) Tweak the finishing details on your Tableau Dashboard
As a final step, the only thing optional to do will be to change your visualization design to have a more appealing story to your network graph.
So now you are fully equipped to create as many network graphs as you please. Don’t be shy and start experimenting and getting to know all of the capabilities that this amazing tool offers us.
For more interesting visualization tips and other data-driven information, visit https://theinformationlab.nl/.