
Crosstabs: adding a single date filed and empty rows or columns
We’re all very familiar with tables, or Crosstabs, as they are called in Tableau. They have their place and purpose even in Dashboards. Additionally they are often at the basis of the large single aggregated numbers in Dashboards and reports. In Dashboard development lingo they are referred to as Big Ass Numbers…
In this blog I will show you two ways to add some additional elements to your Crosstabs. These are a single Date field and blank rows or columns.
For a use case for single Date fields see my blog article and currency exchange calculator here.
Create the basis of the Crosstab
Let’s assume we have a use case for a crosstab with a single date. Then there are a few small steps to take here.
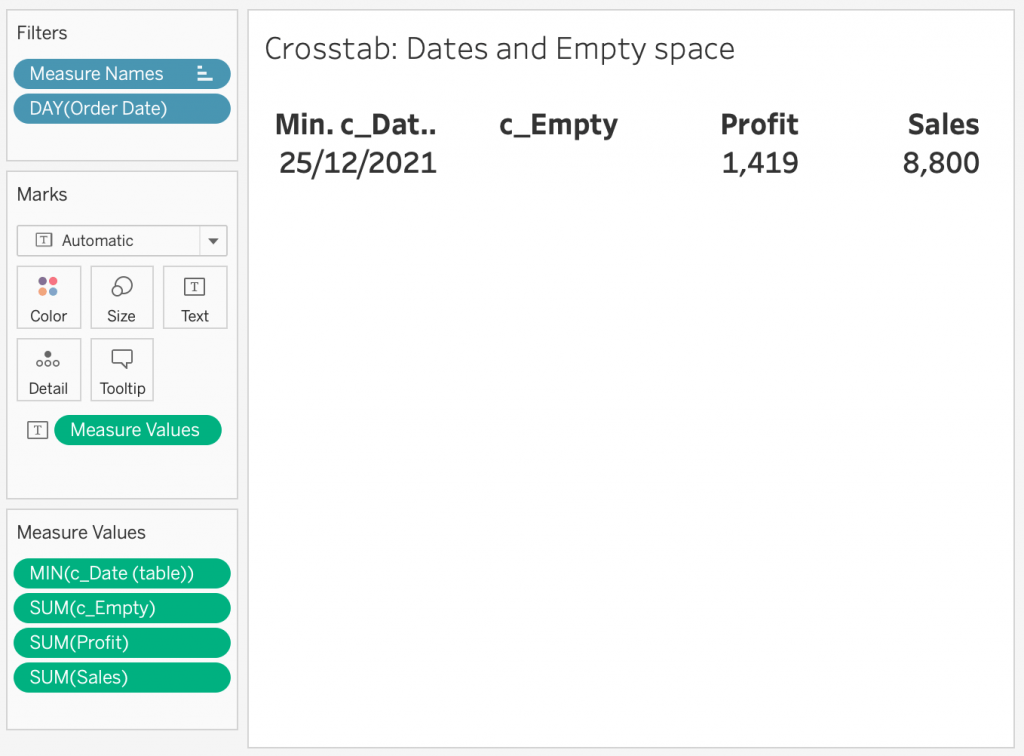
First create a crosstab. You can use the Show Me or drag Measure Values on the Text Marks Card and remove all but one. You can do this easily by selecting the first measure + hold Shift + click the before last measure. Now drag the measure stack off the Measure Value card.
Let’s maintain Sales and Profit.
Adding Date to a crosstab
First put an Order Date filter on your canvas and set it to a single date. In your Dashboard this could be linked to Today() or a Parameter selected date. Set it up as you need.
Then Create a Calculated Field of the Date you want to show, I named it c_Date.
Tip: I put “c_” before my Calculated Fields, “p_” before Parameters and sometimes “f_” before dedicated filters.
c_Date
SUM([Order Date])+2When done drag the new c_Date measure on your Measure Values card. For example above Sales and Profit.
Then format c_Date on the Measure Values card. Ensure that “Field” is selected in the formatting pane appearing over your Data Pane. Select field c_Date, then select Pane and change the number format to Custom. Make it a date format of your choice, e.g. dd/mm/yyyy or ww-yyyy.
Lastly, select the Measure Aggregation. I use MAX. This ensures that in case multiple dates are selected the highest is, but AVG, MIN and SUM (this one sometimes acts up) should all work.
Adding the Empty Row or Column.
Create a Calculated Field named c_Empty.
INT(NULL)Once created drag it on the Measure Values card between c_Date and Sales. To remove the header use Alias and enter a space. This allows further formatting of the other headers.
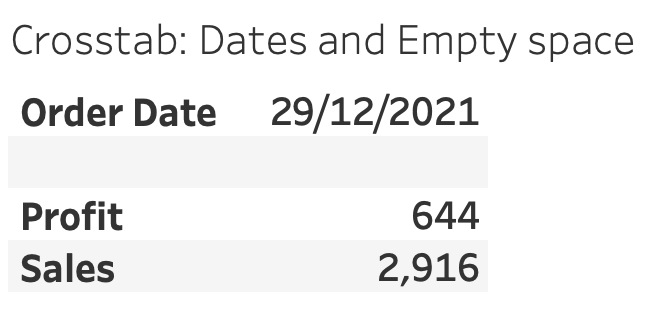
Try out swapping rows and columns for a different look. Remove alternating row color as needed.
That’s all for this blog.
Summary
In this blog article I have shown how to add a date field and empty row/column to a crosstab. As a possible use case I have shown you this public viz where a date is added to convey this key information part to the Dashboard user.
I hope this blog has helped you in further customizing your Dashboards.
If you want to read other blogs about software like Tableau and Alteryx, follow a training course or book a consultant please visit The Information Lab NL for more information.