Showcasing Tableau button images
In this article I show how to add images to buttons. Where to place buttons and where not!
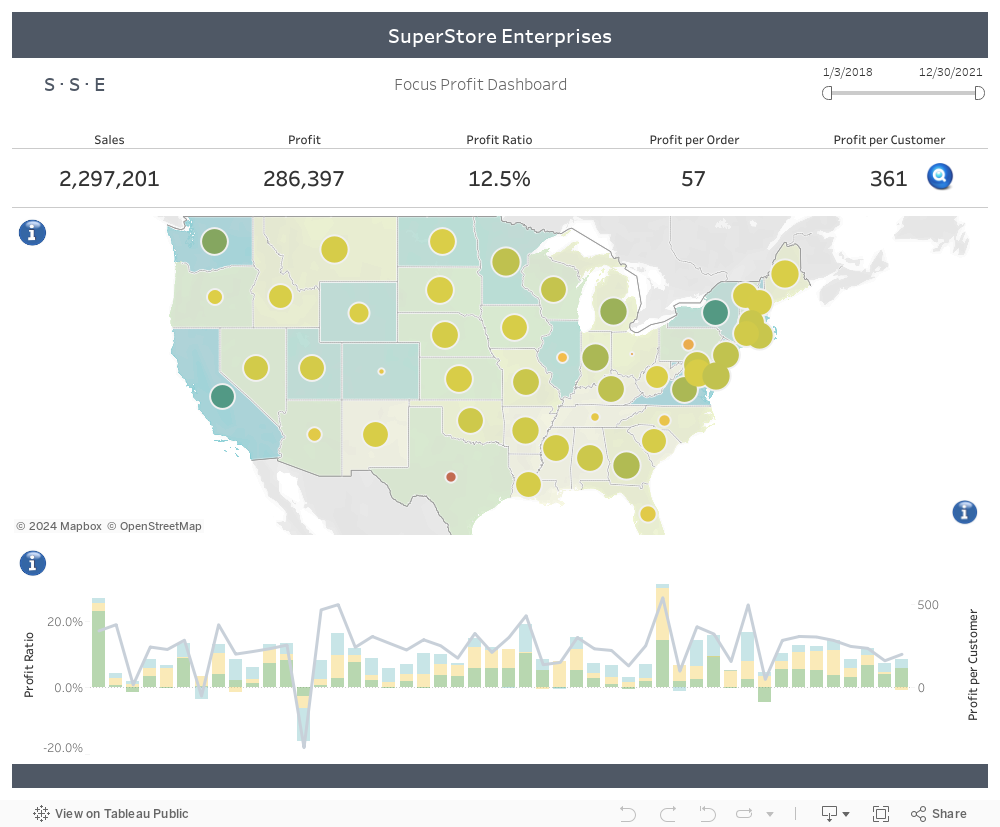
I use this Focus Profit Dashboard to showcase some good and less good examples (see also at the bottom of this blog).
Dashboards are like an expensive housing market. All real estate is valuable due to high demand. This principle also applies to Dashboards. However, within Tableau Dashboard real estate can be hidden and shown using buttons. This can be containers holding one or more graphs or single elements like filters or legends.
In this blog I focus on filters and legends. However a graph or table can also be put under a button action. For example a table (cross tab) related to a bar chart. With a click on of a button the table can appear over the bar chart and can as easily be removed again.
How to Add a Button Image
A button image can be added within the Dashboard. Select any Floating object and go to More Options on the objects side interface. Select add Show/Hide Button.
A button image can be added on the open and close action. No image is also an option. In this case a standard image is shown when Hidden: ![]() (click to open) or when Shown:
(click to open) or when Shown: ![]() (click to close). Alternatively the Button Style can be text or an image.
(click to close). Alternatively the Button Style can be text or an image.
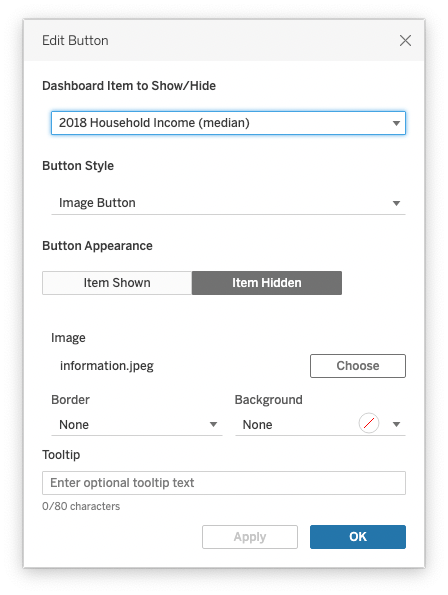
Adding an image is very easy actually. Find an image (rights free or from your organisation) and Choose to add. one to click to Show and one to click to Hide. In addition you could consider adding optional tooltip text.
Tableau Button Placement
Purpose of the Real Estate under a Button
When placing a button first decides on the purpose of the real estate underneath. What is underneath should be of less importance than what you show. However, still being important enough to add. So keep in mind your audience/users etc.
Location of the Button
Secondly, decide on the most appropriate location for the button and the dashboard element. Imagine behing a user, where would they expect buttons for additional information like legends and filters? Top spots are bottom right corners (see the map on the Focus Profit Dashboard) or top left. Place the button and dashboard element in close proximity.
Notice that I have placed a button on these places of the map visual. However placing the top left is inconveniently placed on top of the Map tool interface standard on any Tableau map. Not the best spot, even if a logical place.
I also placed a filter on the BAN row, next to the Profit per Customer number. The idea behind this placement is to allow users to drill down to users in a State (click on the map circles), City within the State where there are recorded Customer Sales, and finally Customer.
Selecting the right Button Image
Thirdly, select the appropriate image (or text label). Unless you are designing a very specific purpose dashboard the best bet is simplicity and recognisability. Here I use the letter i for legends and a looking glass to filter. The shape and appearance stand out from main look and feel. My purpose was to have it stand out for the intended users (being you as reader). The color blue is chosen, because it is often associated with service and information support.
When enough is enough
Lastly, don’t overdo it. More than 1-3 buttons with overlays saturate the overall Dashboard and distract from the main visualisations.
I hope this take on buttons gives you some new insights for your Dashboards
Happy Vizzing!
If you want to read other blogs about software like Tableau and Alteryx, follow a training course or book a consultant please visit The Information Lab NL for more information.
Below Focus Profit Dashboard uses Tableau Superstore data set. Although only made to showcase button placement for this blog its design is aimed at a possible Dashboard for a Sales Team that is being targeted on profitable orders and customers.
E.g. The color of the states is linked to the standard Tableau Map Data Layer functionality. It shows household income for 2018 as an indicator for disposable income. The circles represent State Profit (color) and profit ratio (size). This way Illinois and Texas stand out by size and color contrast between Site and Circle (on the same palette).