Introduction
Tableau is renowned for its powerful data visualization and analysis capabilities. Among its extensive toolkit, however, there is a set of lesser-known yet highly potent helper functions —INDEX(), FIRST(), LAST(), and SIZE(). These functions are essential for creating more dynamic, flexible, and insightful visualizations, allowing analysts to delve deeper into their data. These functions are called the helper functions, which are table calculations. They also depend on the scope and the direction in which the calculation is performed just like calculating a percent of total or a running total.
Using helper functions are essentially used for getting information about the relative position or size of an item within the current scope and direction from the visual. In this blog post, we will explore the practical applications of these helper functions in applicable scenarios. From ranking and highlighting specific data points to creating custom pagination and dynamic thresholds, these functions empower you to unlock new levels of insight and interactivity in your Tableau dashboards. Whether you are a seasoned Tableau user or just getting started, understanding and utilizing these functions can significantly enhance your data analysis capabilities.
Using INDEX()
The function INDEX() alone is used to return the position of the given value based on the scope and direction. The video below shows the use of the index function alone within a table that shows Category and Sub-Category Sales by Segment table:
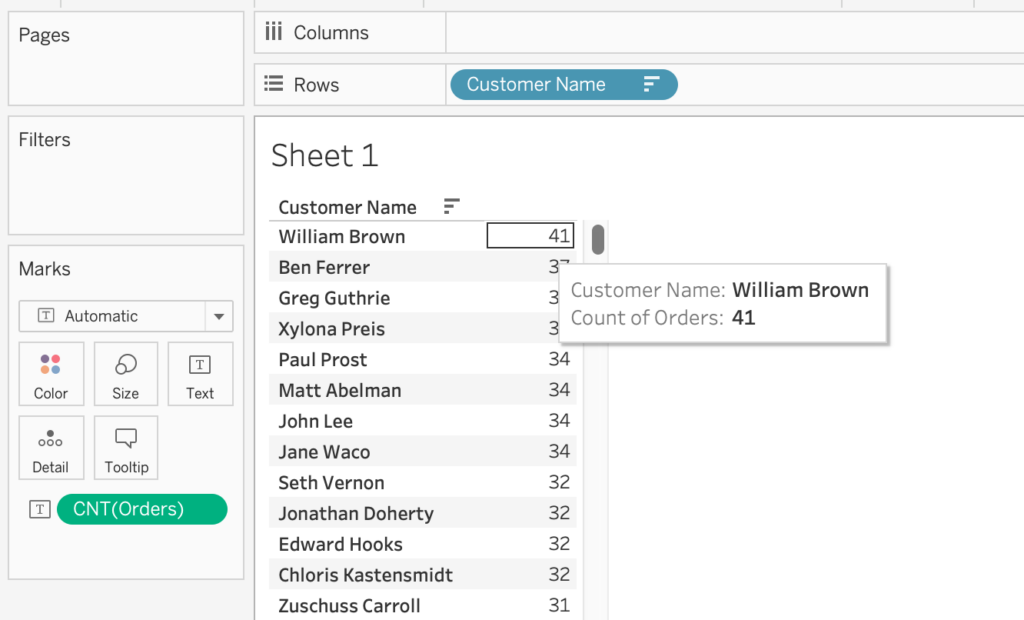
Use case: Segmenting Customers Based on Purchase Frequency
Suppose you have a dataset containing customer purchase information, and you want to segment your customers into different groups based on their purchase frequency. Here’s how you can achieve this using the INDEX() function in Tableau:
1. Sort Customers by Purchase Frequency
Ensure your data is sorted by the frequency of purchases, with the most frequent purchasers at the top.
2. Create a Calculated Field for Segmentation
- Use the
INDEX()function to assign an index number to each customer. - Create a calculated field to define the segments based on the index value. For instance, you might want to group customers into three segments: Top 10, Middle 10, and Bottom 10.
IF INDEX() <= 10 THEN "Top 10 Customers"
ELSEIF INDEX() <= 20 THEN "Middle 10 Customers"
ELSE "Bottom 10 Customers"
END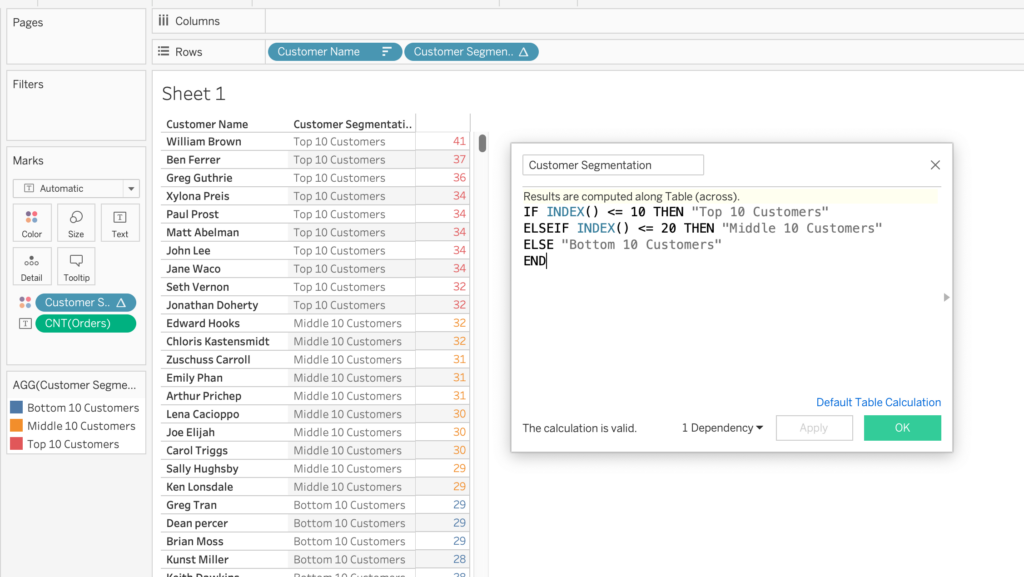
Using FIRST() and LAST()
The functions FIRST() and LAST() return the offset of the position from the current value. Either the first or the last based on the function.
FIRST() returns 0 if the current value is in the first row and returns -1 if the current value is in the second row, and so on. LAST() returns 0 if the current value is in the last row and returns 1 for the previous row and so on.
Use Case 1: Highlighting
You can use the FIRST() function to highlight the first few rows in the visualization for emphasis reasons. For example, highlighting the first 3 rows in a sorted list for top sales.
Use Case 2: Filter for Recent Data
You can use the LAST() function to show the most recent data points. For instance, displaying the latest transactions. For example the last 5 transactions in a customer’s activity log.
Using SIZE()
SIZE() is used to return the number of rows in a partition that is determined by the level of detail of your view and the scope setting. A partition refers to a subset of the data determined by the dimensions used in the view. When SIZE() is used, it counts the number of rows.
Use Case: Dynamic Threshold
You can use SIZE() function to set a dynamic threshold to check if the number of rows returned is below a certain threshold. Say if the number of rows returned is less than 5, then we have insufficient data, otherwise sufficient data.
IF SIZE() < 5 THEN "Low Data Volume"
ELSE "Sufficient Data"
END
Conclusion
By using INDEX(), FIRST(), LAST(), and SIZE() together, you can create a comprehensive and insightful analysis in Tableau. This approach allows you to rank, highlight, segment, and analyze data effectively, providing deeper insights into customer purchase patterns and behaviors. This example demonstrates the power and flexibility of these functions when used in combination to address complex analytical requirements.
Thank you for reading this blog. Also check out our other blogs page to view more blogs on Power BI, Tableau, Alteryx, and Snowflake.
Work together with one of our consultants and maximize the effects of your data.
Contact us, and we’ll help you right away.