
Data visualization tools like Tableau and Power BI have become indispensable for businesses and data professionals seeking to gain insights from their data. Both of these platforms offer powerful features for creating interactive and informative visualizations. However, they often approach the same concepts differently, which can be a bit confusing for users who are familiar with one but new to the other. In this blog post, we’ll explore some of the most important concepts that exist in both Tableau and Power BI, highlighting their similarities and differences.
This blog series is split into two parts. In this part, the concepts mentioned will be on Calculations, Filters, and Slicers and Connection Types. For each of the core concepts, a short description will be given of how they are done in both Tableau and Power BI as well as a short video demonstrating the concept.
Calculations:
Tableau:
In Tableau, users can create calculated fields by writing formulas using the calculation editor or manually entering calculated expressions. The calculations will either be classified as dimensions or measures. Dimensions represent unaggregated data meanwhile measures represent aggregated data.
Power BI:
Power BI allows users to create calculated columns and measures through DAX (Data Analysis Expressions) formulas. Calculations are made in the Power Query Editor for calculated columns and in the “Model” view for measures. New columns are static and calculated based on existing data, while measures are dynamic and based on aggregated data. This is something unique to Power BI.
Differences:
The primary difference is in the language used for calculations. Tableau uses its own syntax, while Power BI relies on DAX, which can be more powerful for advanced calculations. However, Tableau’s own syntax is much simpler in terms of the way the calculations are built and also by means of user-friendliness. Unlike Tableau, the type of new field to be created needs to be determined first in Power BI (measure or column). Meanwhile, in Tableau, the type of the field can be changed from dimension to measure afterwards.
Filters and Slicers
Tableau:
Tableau allows users to add filters to dashboards and worksheets, as well as create interactive “quick filters” for on-the-fly data exploration. These filters can be shown so that the user can interact with them when dashboards are published. Fields put in the filter card will enable filtering.
Power BI:
Power BI can use slicers to filter data, offering a similar way to control data displayed on a report or dashboard. They are placed on the report from the visualizations pane. However, there is also a completely separate pane called “Filters” where fields can be placed in there to do filtering, rather than on the report itself. This pane is available to the users on the Power BI service after the report is published.
Difference:
The core concept of filtering data remains consistent across both platforms, but the user interface and terminology differ. Tableau’s quick filters are akin to Power BI’s slicers.
Connection Type
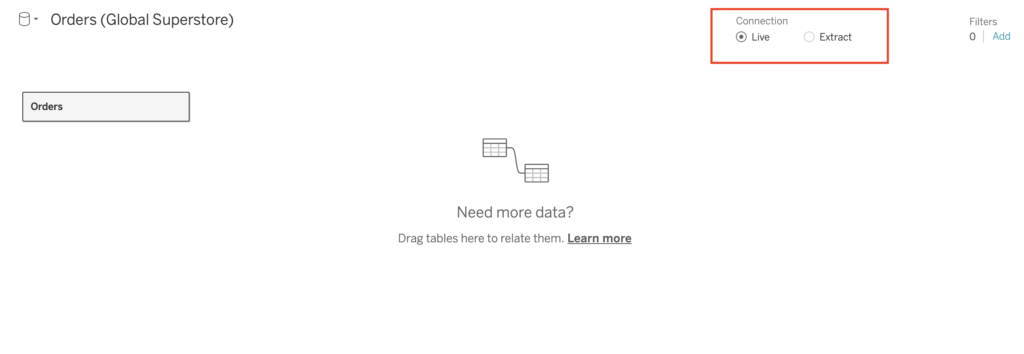
Tableau:
Tableau has two means of connecting to data. A live connection or an extract. a “Live Connection” means that data remains in its original source, and Tableau queries the data source in real time when you create visualizations. An “Extract” in Tableau is a snapshot of data from a data source that is stored in a highly compressed and optimized format in a Tableau-specific data engine. Mainly used for performance reasons.
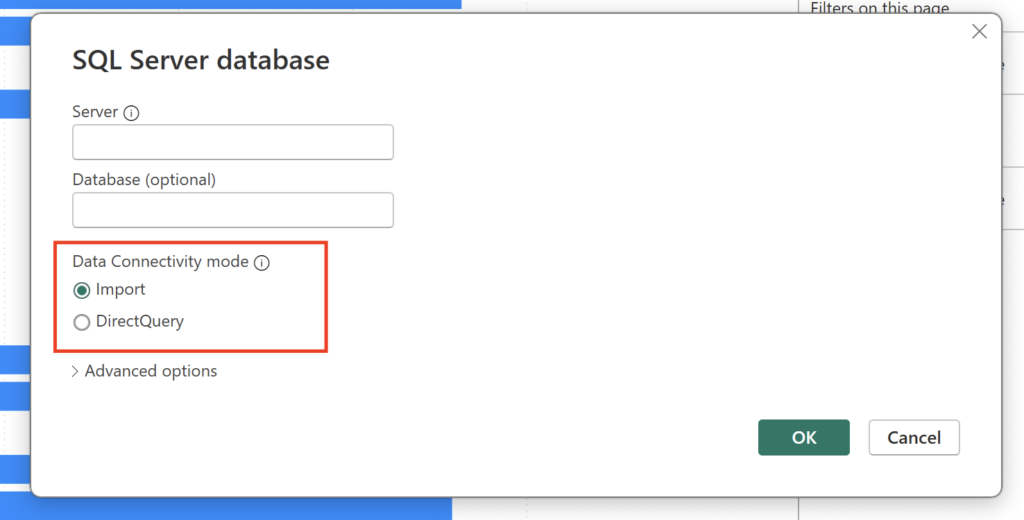
Power BI:
Very similar to Tableau, Power BI also offers two means for connecting to data: Import or DirectQuery. “Import” refers to loading data from a source into the Power BI data model. When you import data, it is copied and stored within the Power BI file (PBIX). It offers fast performance as data is stored locally. “DirectQuery” in Power BI is an option to connect to data sources without importing the data into the Power BI model. Instead, queries are sent directly to the source for every visualization.
Difference:
The two methods that exist for data connection type are almost the same in what they perform in both softwares. The Live connection method in Tableau is akin to DirectQuery in Power BI. Similarly, the Extract in Tableau is akin to the Import method in Power BI. However, while the import mode supports most connections from Excel, CSV, Server connections, the DirectQuery mode is only available for Server connections like SQL server, Amazon Redshift, Oracle etc…
Final Remarks
Tableau and Power BI are two of the most popular data visualization tools, each with its unique strengths and features. While they share many core concepts, the way these concepts are implemented can differ. Understanding these similarities and differences is crucial for users who switch between the two platforms or work in organizations that use both. By recognizing these distinctions, data professionals can effectively leverage the capabilities of both Tableau and Power BI to create impactful data visualizations and gain deeper insights from their data.
Thank you for reading this blog. Also check out our other blogs page to view more blogs on Tableau, Alteryx, and Snowflake here.
Work together with one of our consultants and maximize the effects of your data.
Contact us, and we’ll help you right away