
Less is more. As data analysts we don’t want to see tables with dozens of columns and millions of rows! We just want to see a visual summary. But even a nicely organised Tableau dashboard can show too much information. So we filter our data to limit the amount of information in our view. But did you know there is another way besides regular datafilters? In this blog, I will show you 3 ways to use parameters to filter your data in Tableau
What are parameters in Tableau?
When working with Tableau, most data you will use will either come directly from your datasource(s) or will be based on it. Calculated fields, for example, will almost always refer to one or more fields in the datasource as base for further calculations. And even if the calculations are not based on other values in the table, they will be added to it as such. Table calculations, too, are calculations based on the values in the original data source within a view.
Parameters, however, are workbook variables and operate independently of the data to which you are connected. Make no mistake, parameters can be based on fields from the datasource. They can, but they don’t have to. Parameters let users define the values and this is exactly what makes parameters such a powerful tool to use for effective dashboards. It is not hard to think of a ton of different use cases for parameters. In this blog, I will focus on how you can use parameters in your dashboard as filters.
What are filters?
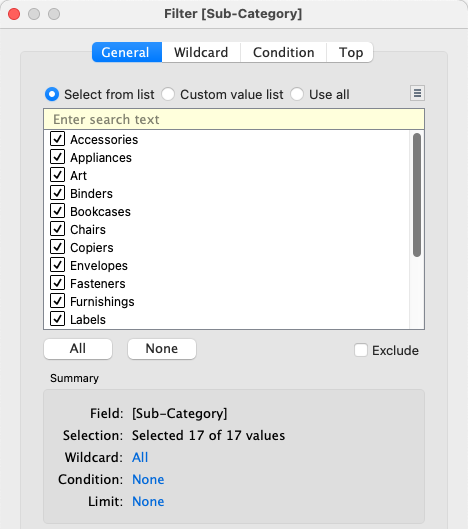
There are five types of filters in Tableau: extract filters, data source filters, context filters, dimension filters and measure filters. The first two of these fall outside of the scope of this blog, since we want to filter data that is already in our workbook. In your everyday dashboard, filters and parameters are visually almost identical. Apart from some formatting quirks, they appear to function in the exact same way.
However, there is one big difference. This difference becomes evident when we set a filter. To do so, we drag a field to the filter card. The implication is that when filtering, we limit the number of values from this column in the data source. Only the values that exist in a field can be filtered out. It does not matter if it’s a context, dimensions or measure filter, they all work like this. For parameters, we don’t have this restriction.
How to use parameters as a filter
Parameters have no direct relationship to the data source. This means that the possible values for a parameter are practically limitless. However, this also means that in order to use a parameter as a filter, we have to connect it to our data somehow, in order for it to do anything. Here are some ideas to use parameters as filters.
Parameters have no direct relationship to the data source. This means that the possible values for a parameter are practically limitless. However, this also means that in order to use a parameter as a filter, we have to connect it to our data somehow, in order for it to do anything. Here are some ideas to use parameters as filters.
1. Filter fields instead of field values
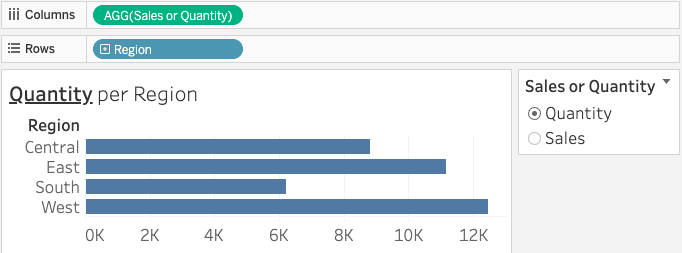
Let’s say our client wants to create two visualisations: sales per region and items sold per region. There is not much space on the dashboard. But because different products are sold at different prices between regions, the client does not want these measures to be shown in a dual axis chart as this could skew interpretation. Fortunately we can create a swap parameter that enables us to choose which measure we want to show per region.
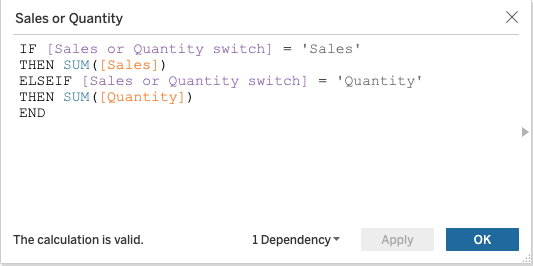
First we set a string parameter to contain two values: Sales and Quantity. To connect it to the data, we create a calculated field. Let’s call it [Sales or Quantity]. With the help of some conditional logic, we can define that if the parameter is set to Sales, the field returns the sum of [Sales]. And if the parameter is set to Quantity, the field returns the sum of [Quantity].
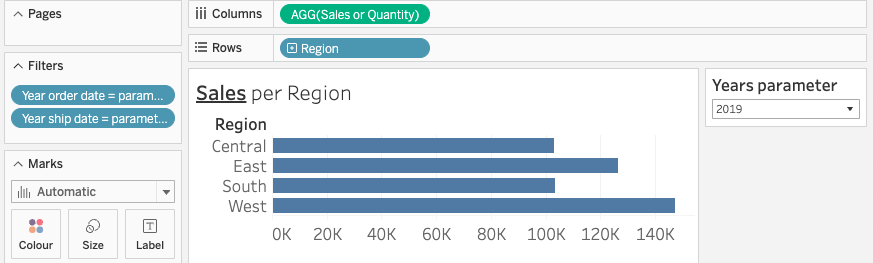
Now we drag [Region] and [Sales or Quantity] to our view and select Show parameter. The view will show the desired measure for each region. To really finish this off, we can use the parameter to dynamically change both the visualisation title and the axis title (latest Tableau version) to reflect our chosen measure. In similar fashion, we can also choose between more measures, or add another parameter to also choose between different dimensions.
2. (Re)use one parameter to filter more than one field
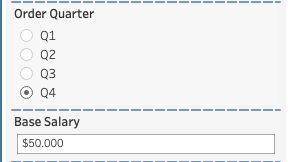
Sometimes we have several fields in a dataset with a similar set of values, date fields for example. Or maybe we use almost the exact same fields but in different tables or data sources. Using a parameter, we no longer need to set the filtered values for each field individually. Let’s assume we have a workbook with several date fields. Once we have set up our view, we want to filter our view to only show specific years. We can now create an integer parameter and define its possible values.
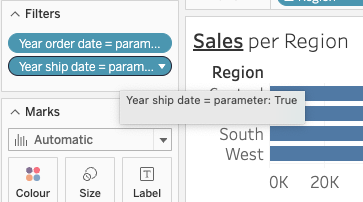
There are two ways to connect our parameter to the data. The first way is to create a boolean field that we are going to drag to the filter card. We check the year of our date field, in this case [Order date], to see if it is equal to the selected parameter value. This check returns either True or False. If we use this new field as filter, we can filter all values for which the expression is true (or false, if we would want to exclude the selected field). If we do the same for the field [Ship date], we can drive both filters on the filter card using only one drop down menu.
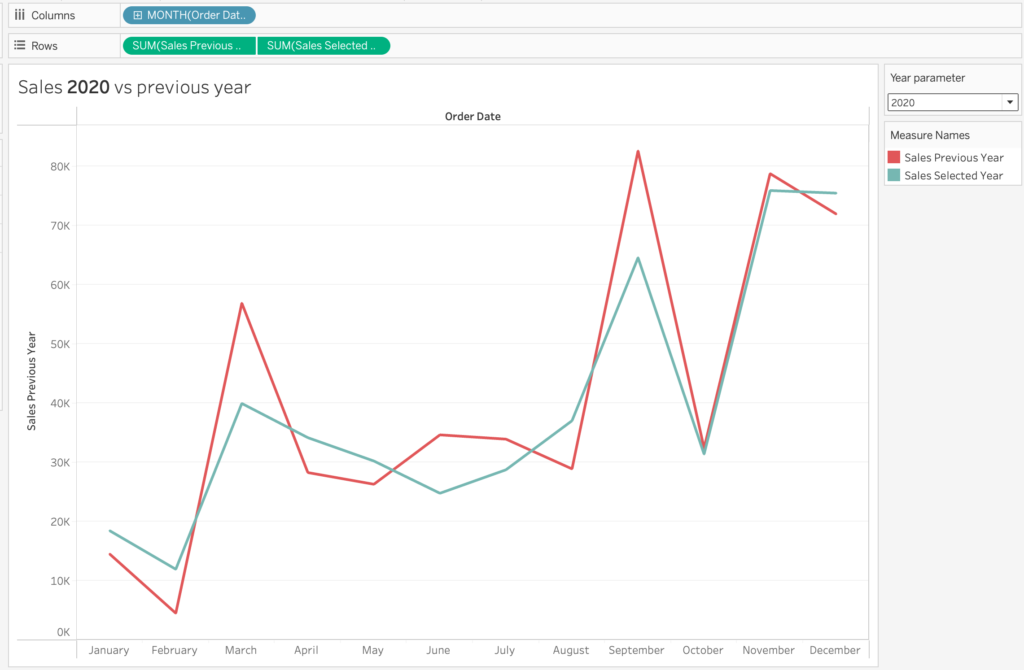
3. Use one parameter value for different offsets
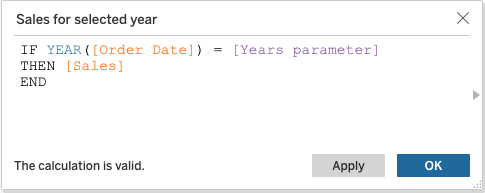
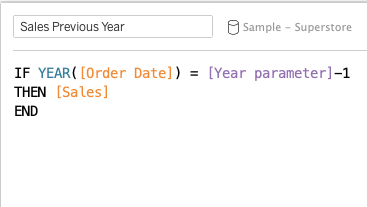
Another option would be to create a calculated field that includes the condition, and only shows us values for when this requirement is met. This way, the filter only applies to this specific field, and not the other fields in the view. Of course, we can also use the same principle to create different offsets based on one parameter. We could create a field that shows a measure value for a selected year YEAR([Order Date] = [Year parameter], and create a second field that only shows the same measure values for the previous year YEAR([Order Date] = [Year parameter]-1. Now we can compare the values for both years in one dual axis chart.
Final thought
These were 3 ways to use parameters to filter your data in Tableau. Howver, there are two more things to keep in mind when using parameters as a filter. The first one is that parameters are single select only. There is no out of the box (All) option like there is with regular filters.
Consequently this means that unless you find a workaround, you will always filter out some of the data. The second point, as a consequence, is that you cannot use dashboard actions to show all values again. Instead, you need to anchor it to a constant field in your dataset using a parameter action in order to determine which information you want to show.
How? I will show you in my next blog.
Check out our other blogs about Tableau, Alteryx, and Snowflake.
Team up with one of our consultants and get everything out of your data.
Contact us, and we’ll help you immediately.