Combining Data in Tableau
When it comes to combining our data within Tableau, we have three options. Joins, Relationships, and Blends. Each technique has its best use cases as well as its own limitations. Joins are the most traditional way to combine data. Where we combine tables with similar row structures together to create a larger physical table. Relationships are the default way to combine data in Tableau that perform in a dynamic way. Where joins between tables are created when they are used in views. Best used when tables have different levels of detail. Both these methods are configured within the data source. However, there is the other method of combining data that is a little different: Blending. In this blog, we will shortly explore what blends are. Then go over some common problems that users might run into along with some workarounds for them.
What are Blends?
The one characteristic that makes blends different than Joins and Relationships is the fact that instead of combining data within a data source, we are combining different data sources. Remember data sources are files containing all the connection information to different files/servers plus all the customizations that you make in Tableau. Blends do not combine data directly from the source. But are performed on a sheet-to-sheet basis. Making them also unpublishable like actual data sources.
Similar to Joins and Relationships, however, we still establish a common field to link in between the two sources. If the column name is the same as the two data sources, we use those fields as a common link.

Also similar to joins, blending data is comparable to a left join. We retain all the information in the primary data source. But only the matching results are shown from the secondary data sources. The primary data source will be marked with a blue tick and secondary data sources will have an orange tick after blending. A big key difference between joins and blends is also that with joins the data is joined and then aggregated. With blends the data is aggregated, then joined.

Check out this source on Blend Your Data for more details on how to configure a blend.
The important thing to keep in mind is that Blending should only be performed if there is no way to make the same connections within one data source. This is due to the limitations this technique brings when compared to Joins or Relationships. Let’s go through some of these limitations and potential workarounds for the issues.
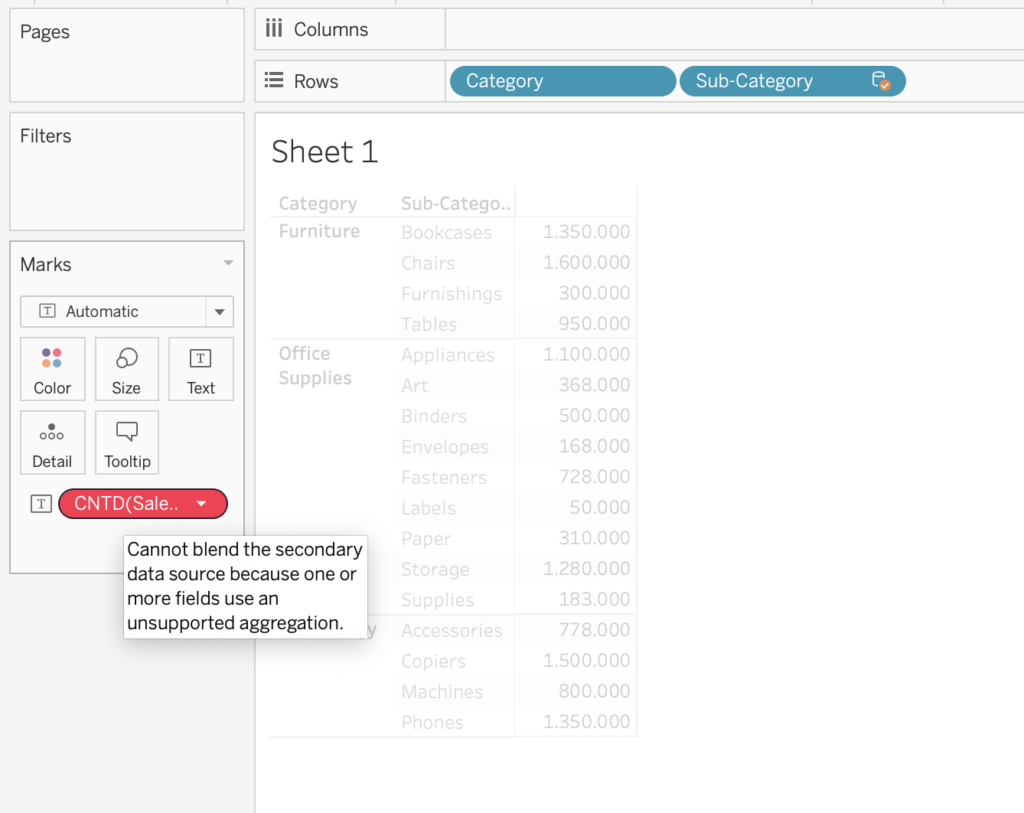
Common Issue #1: Cannot blend the secondary data source because one or more fields use an unsupported aggregation
The aggregation methods of COUNTD, MEDIAN, and other non-additive aggregate functions can cause fields to become invalid. This error generally comes when the two sources are on different levels of aggregation.

Furthermore, this error can occur for various different reasons. To use non-additive aggregates from the primary source, the data must be coming from a relational database that allows temporary tables to be used. For use in secondary data sources, the linking field from the primary data must be included in the view. This error can also be shown from the use of LOD expressions from the secondary data source.
Workarounds:
- Modify the Aggregation: You can modify the aggregation level of the field in the secondary data source so that it matches the level of the field in the primary data source. For example, if the primary data source has a daily aggregation, you can change the secondary data source to match that aggregation level.
- Create a Calculated Field: You can create a calculated field in the secondary data source that uses an aggregation supported for blending. For example, if the primary data source is using the SUM aggregation, you can create a calculated field in the secondary data source that also uses the SUM aggregation.
- Use a Data Extract: Creating a data extract can sometimes help resolve unsupported aggregation errors by creating a static, aggregated view of the data that is more compatible for blending.
- Use a Join instead of Blending: If blending is not necessary for your analysis, you can try joining the data sources instead. This can sometimes help resolve the unsupported aggregation error.
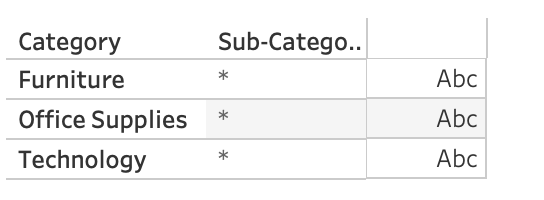
Common Issue #2: “*”
After blending, if there are multiple matching dimension values coming from both of the sources, we will see an asterisk (*). Kind of like if we made a dimension with multiple values and attributes. Like ATTR([Sub-Category]).

Workarounds:
- Avoid this issue by ensuring only one matching value between your sources. Adding a higher granular field from the primary source can resolve the issue. For example, using “City” instead of “State”.
- Rebuild your view and switch the primary and the secondary data sources. The source with a higher level of granularity should be the primary source.
Common Issue #3: Dealing with NULL Values After Blending
The reason for appearance of NULL values after blending can come from different reasons. There can be a mismatch in casing and data types between the sources. Or that the secondary data source does not contain values for the corresponding ones coming from the primary.
Workarounds:
- Check if the casing and the data types of fields are the same in between the data sources: Use calculations such as PROPER(), UPPER, LOWER() to modify the casing. If there is a data type mismatch, change it from the data pane from the icons next to the field names. Or write calculations for type conversion like STR() or INT().
- Use the Data Source Tab: In the Data Source tab, you can right-click on the blended field and select “Replace Missing Values” to replace null values with a specified value. You can also select “Fill” to fill null values with the value from the previous or next non-null cell.
- Use IFNULL Function: You can use the IFNULL function to replace null values with a specified value in a calculated field. For example, you can create a calculated field that checks if a field is null and returns a default value if it is.
- Use ISNULL Function: You can use the ISNULL function to create a calculated field that identifies null values in the blended field. You can then use this calculated field in your analysis to handle null values accordingly.
Final Remarks
Thank you for reading this blog. Also check out our other blogs page to view more blogs on Tableau, Alteryx, and Snowflake here.
Work together with one of our consultants and maximize the effects of your data.
Contact us, and we’ll help you right away.


