
Tableau Change Parameter Action with Calculation
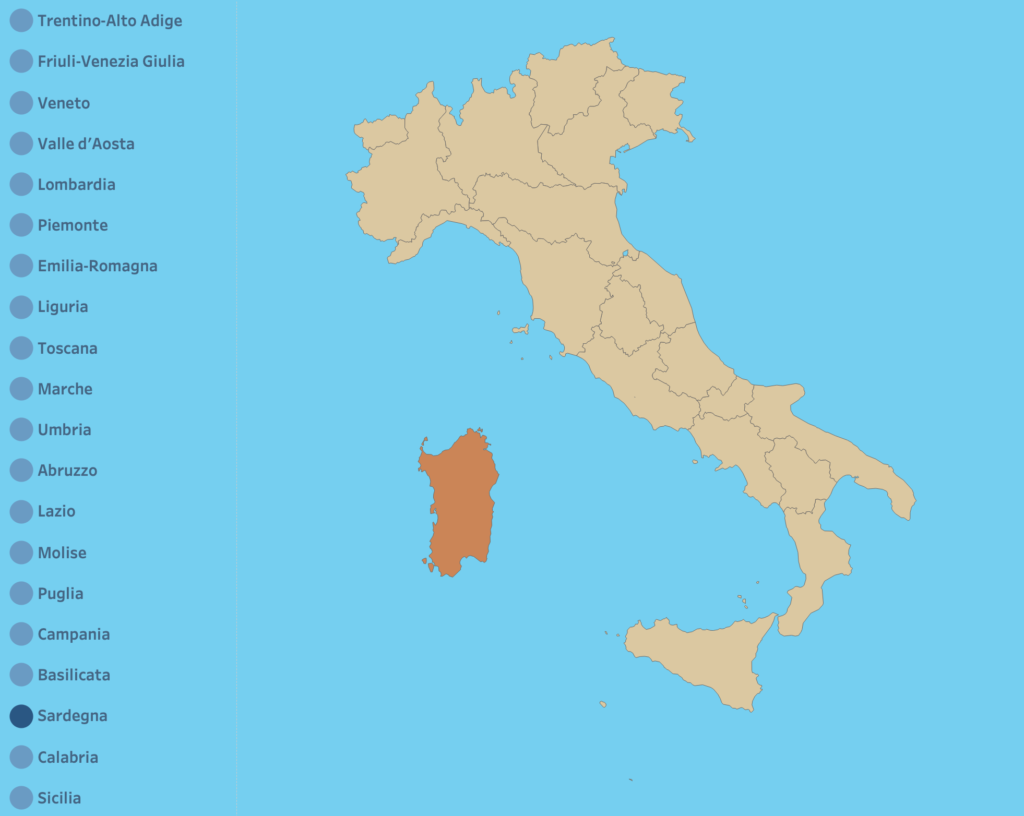
In Tableau, you can set a parameter by selecting a value in your dashboard. This is a very nice feature, because it can make your dashboard more interactive: the parameter can dynamically update what is displayed in the view. So if you select Sardegna (Sardinia, an Italian island) on your dashboard you can set the value of your parameter to Sardegna. As a result you might see the island highlighted on a map (see below). The value the Parameter is set to can be just a string (e.g. the name of the island). You can also create a change parameter action with a calculation however!
If you want to set a parameter tot a different value that the one you selected, you need to make Tableau understand what you want. You can do that using VizQL and an aggregate function that leads to the right value. We also need a nested LOD Expressions. In this blog we will walk through the process step by step using an example dashboard.
Italian Regions Example
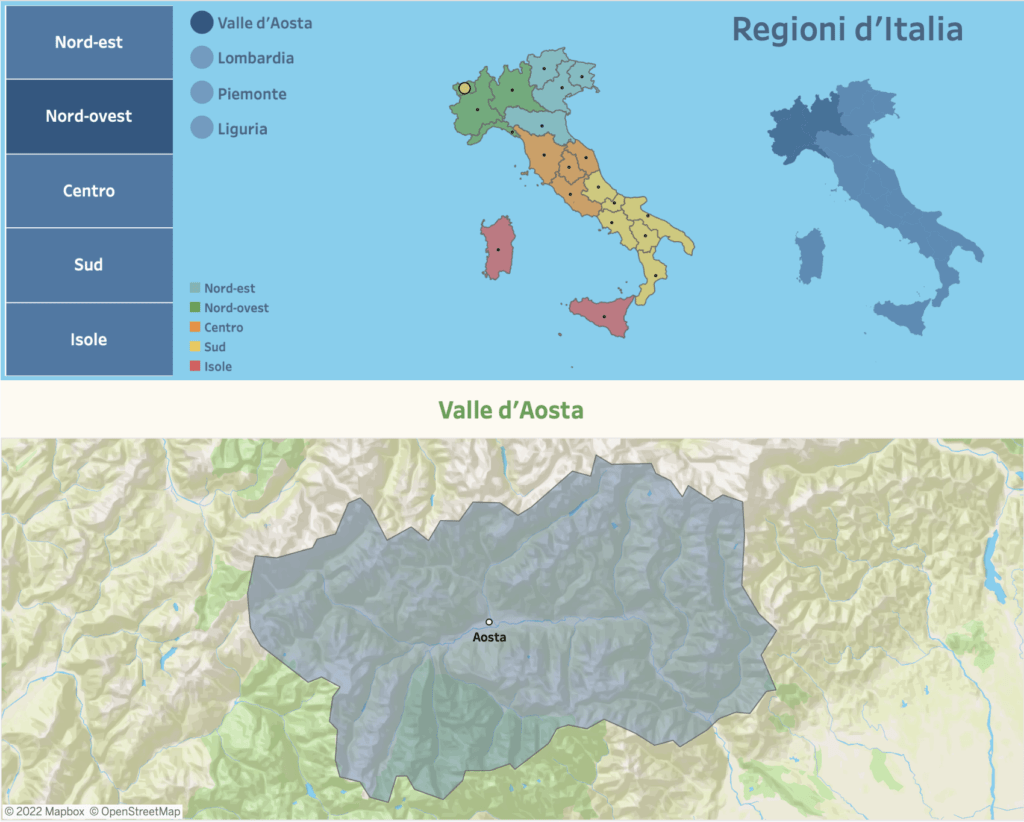
Recently, I made a Tableau Public Vizualization that showed the regions of Italy. The regione in Italy is an administrative entity in the Republic of Italy. These regions can be grouped in macroregioni or macroregions. For example: the Centro macroregion consists of Umbria, Toscana, Marche and Lazio.
In the visualisation there is a menu where one can choose one of the macroregions. Immediately next to it there is a radio button that shows only the regions of that macroregion. In the image below you can see the Nord-ovest macroregion selected in the menu. Valle d’Aosta is selected with the radio button.
The Dataset
The dataset I used was a simple CSV that contained data from this wikipedia article.
#, Stato, Macroregione, Regione, Capoluogo, lat
1, Italia, Sud, Abruzzo, L'Aquila, 42.2913
2, Italia, Sud, Basilicata, Potenza, 40.5192
3, Italia, Sud, Calabria, Catanzaro, 39.0387
4, Italia, Sud, Campania, Napoli, 41
5, Italia, Nord-est, Emilia-Romagna , Bologna, 44.44
6, Italia, Nord-est, Friuli-Venezia Giulia, Trieste, 46.1169
7, Italia, Centro, Lazio, Roma, 42.0268
8, Italia, Nord-ovest, Liguria, Genova, 44.2281
9, Italia, Nord-ovest, Lombardia, Milano, 45.6661
10, Italia, Centro, Marche, Ancona, 43.3325
11, Italia, Sud, Molise, Campobasso, 41.7185
12, Italia, Nord-ovest, Piemonte , Torino, 45
13, Italia, Sud, Puglia, Bari, 41.25
14, Italia, Isole, Sardegna, Cagliari, 40
15, Italia, Isole, Sicilia, Palermo, 37.4784
16, Italia, Centro, Toscana, Firenze, 43.4259
17, Italia, Nord-est, Trentino-Alto Adige, Trento, 46.3871
18, Italia, Centro, Umbria, Perugia, 42.9947
19, Italia, Nord-ovest, Valle d'Aosta, Aosta, 45.7281
20, Italia, Nord-est, Veneto, Venezia, 45.7443
As you can see every macroregione contains multiple regioni, with a latitude value (that I added using the export crosstab functionality of Tableau). For every macro-region there is a region with the highest latitude value: the highest latitude means that it is the northern-most region.
Menu Bar Chart
In the visualisation I made use of a Menu Bar Chart. Check out my blog about this technique for more information. If you select a macro-region, the visualisation will show a sort of radio button next to it, that lists the regions that are part of the selected macro-region. That list is clickable as well and it shows only the regions that are part of the macro-region. Very nice!
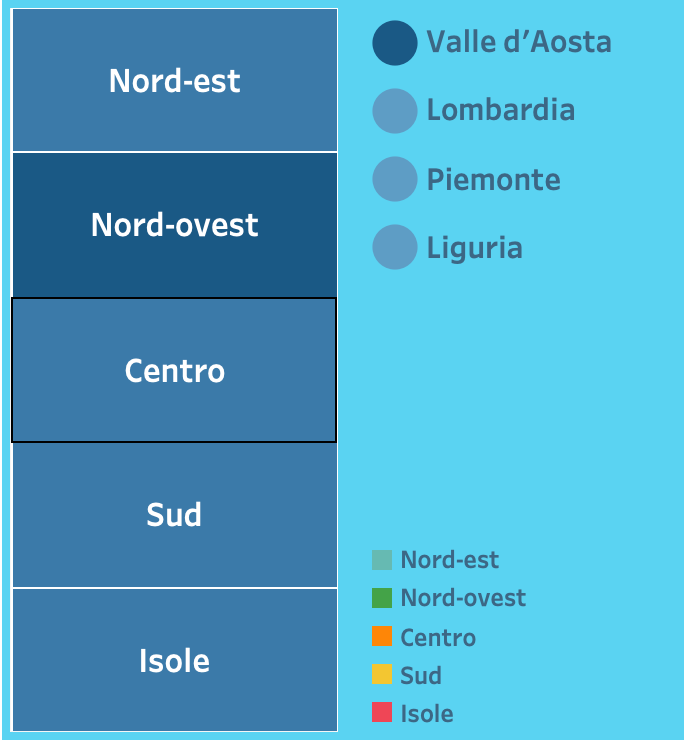
But the list is in alphabetical order by default, which is not that intuitive. Since the radiobutton is displayed vertically from top to bottom (or from north to south), how natural would it be if the regions were also sorted from north to south! We can do this by sorting the list based on latitude. (This is actually why latitude is included in the dataset in the first place.)
There is only one problem: we also want the top-most radiobutton item to be selected every time the user chooses one of the menu bar chart items. In order to do that we need to create a Calculated Field that can be used to pick the right region in a Change Parameter Dashboard Action.
Change Parameter Dashboard Action
Selecting a region with a radiobutton directly sets a parameter. This immediately reflected in the visualisation. But what happens when we select the menu button to the far right? If we want anything to happen we need to add a Calculation to the Change Parameter Action. Otherwise, the parameter would still be set to the old region.
We could go for a simple alphabetic MIN() or MAX() Function, where the alphabetically first region would be selected.
MAX([Regione])We then save this as a Calculated Field. After which we create a Change Parameter Action. Make sure the new Calculated Field is selected as the Source Field.
Now every time we select a macroregion from the menu bar chart, Tableau automatically selects the alphabetically last region for us. But I kind of like the idea that the northern most region within the macro-region is selected. This also matches the north to south sorting of the radio buttons.
The Calculated Field
The following Calculated Field can be used to do exactly that.
{FIXED [Macroregione]:
    MAX(IIF([Lat] = {FIXED [Macroregione]: MAX([Lat])}
    , [Regione]
    , NULL
    ))
}
Let’s walk through what happens here. First we want a Fixed LOD Expression that establishes a single value for every [Macroregione]. If you used a MIN or MAX aggregate here we would be done, but without the desired values. So we need a way to pin-point the exact value we are looking for.
In essence we want there to be 1 value, the northern-most value. We can determine what is the northern-most value for every [Macroregione] with an LOD Expression: { FIXED [Macroregione]: MAX([Lat]) }. Now we need to make sure that our top-level LOD Expression selects only the [Regione] that exactly matches this value and not any of the other values. We use an IIF() Function for that: it checks whether this condition is met, outputting the [Regione] only when the region has that latitude value. If the values do not match a NULL is outputted.
If we then nest this IIF() Function inside a MAX() Aggregate Function, we have essentially made sure that only the 1 [Regione] value is selected for the top-level LOD Expression, excluding the NULLs. And voilà, We now have what we need to make our dashboard behave the way we want!
Conclusion
We looked at setting up Change Parameter Actions with Calculations in Tableau. With a help of a Calculated Field and 2 LOD Expressions we were able to achieve what we wanted in our example dashboard. Selecting a macro-region now sets the parameter to the northern-most region within that macro-region. I hope you found this blog useful!
Make sure to visit our site The Information Lab NL to see more blog posts, training and consultancy services regarding Tableau, Alteryx and Snowflake.