
In this blog post, I wanted to compile a number of topics that I believe are an important aspect when working with Tableau as a beginner to intermediate user. I believe that the following topics are crucial to understand to progress into becoming a more knowledgable Tableau user. In addition, these topics open the doors to performing certain more advanced techniques in Tableau. Without further ado, lets get into these top 3 core topics for becoming a more well-rounded Tableau user.
#1 – Measure Names and Measure Values
First of all, one of the most important elements of Tableau is the measure names and measure values. From the start, Tableau categorises the fields in your dataset to measures and dimensions. In short, measures represent quantitative figures such as sales or profit. Numbers essentially. The categorical values will be categorised as dimensions. Don’t forget that it is possible to reassign after Tableau automatically did. If you want to refresh your memory on measures and dimensions, read this help documentation first.
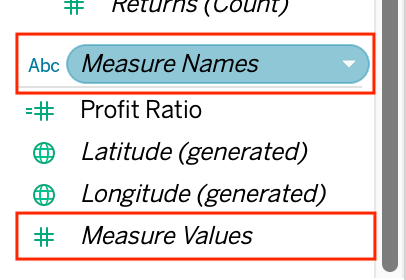
Another automatic tasks that Tableau does upon importing data is to generate two new fields. “Measure Names” and “Measure Values”.
These new fields allow you to add multiple measures in your views that are clearly separated. I can have multiple measures in my view in Tableau. But it is most of the time not how I want it to look like. Lets say I want to build a simple cross-tab of sales and profit separated by sub-category. Lets see how it would look like with using measure names and values and without:
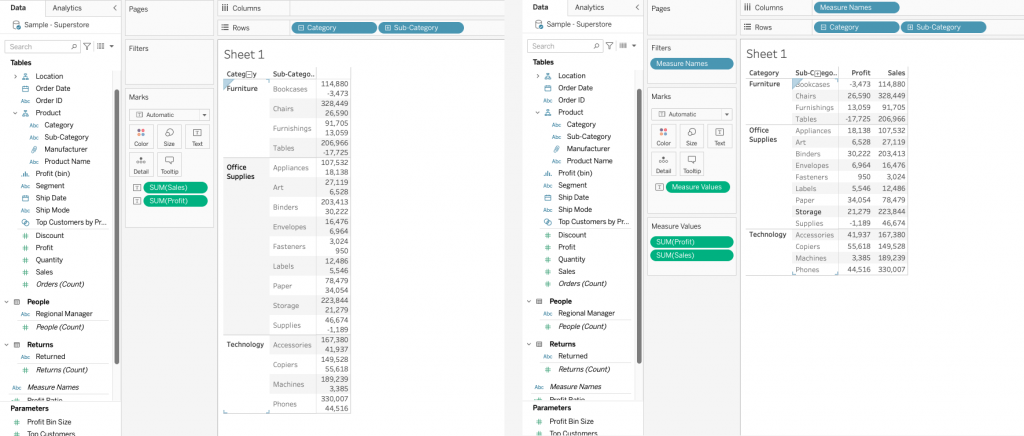
As it can be seen, without using measure names, my values are placed in sub-categories. When I use measure names and values, I can clearly separate them into different columns in my crosstab. As a side note, the graph on the right was made by dragging the second measure into the middle of the view with the figures and dropping it down.
The Process
In a nutshell, measure names are a discrete fields possessing each name of the measures that are in your dataset. Measure values on the other hand is a continuous measure containing the values for each of those measures. Once the measure values field is used in the view, a new card will appear with all your measures. If you start deleting some of those fields from the new card. Then Tableau puts the measure names on the filters shelf. Because essentially, without the filter on measure names. You will be using all of the measures in your dataset. If I wanted to just have my Sales and Profit fields in the crosstab example above, all the other measures need to be filtered out in the filter shelf.
There are a number of chart types and configurations you can do within with measure names and values. Read over this help documentation to get more information about measure names and values.
#2 – Date Parts and Date Values
Another confusing topic that comes across in learning to work with dates in Tableau is the distinction of date parts and date values. This is somewhat similar to measure names and values in the sense that we are dealing with a measure and a dimension again.
When you put a date field into the view, it is automatically a date part to start with (blue). However, that can be changed with right-clicking the pill:
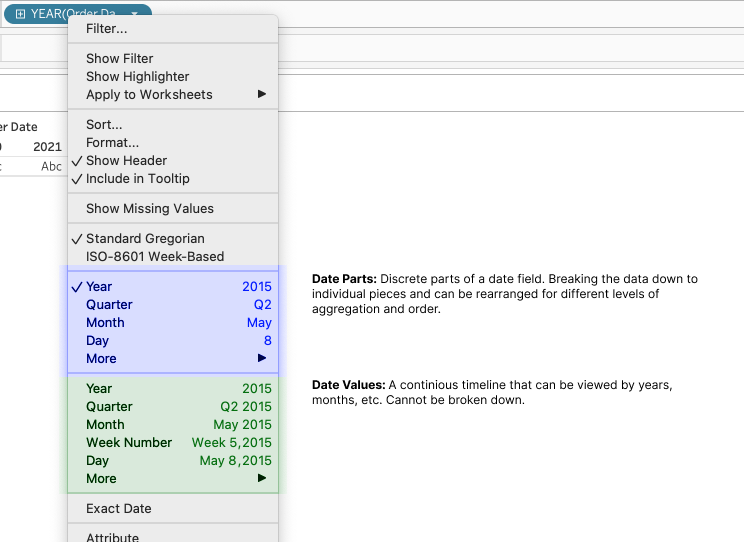
Using either date parts or values do have their individual benefits depending on the type of analysis you would like to perform. So for date parts, the best use cases is doing comparative analysis and comparisons in text tables.
As for date values, since they display chronological progress, their best use cases include doing forecasts and trend analyses.
It is not that uncommon that people perform analyses with Tableau with using dates and don’t exactly know the difference between the two types. Eventually running into problems with their results not looking as they want. Therefore depending on the type of analysis, it is important to know the difference. For more in-depth exploration of date parts and date values, visit this site.
#3 – Tableau’s Order of Operations
Finally, The last prominent topic in this blog to understand is Tableau’s order of operations. The order of operations refer to the order in which Tableau executes each task that is specified for it to do. These operations include filters, calculations, forecasts, and more. Here is a very helpful graphic showing the order:
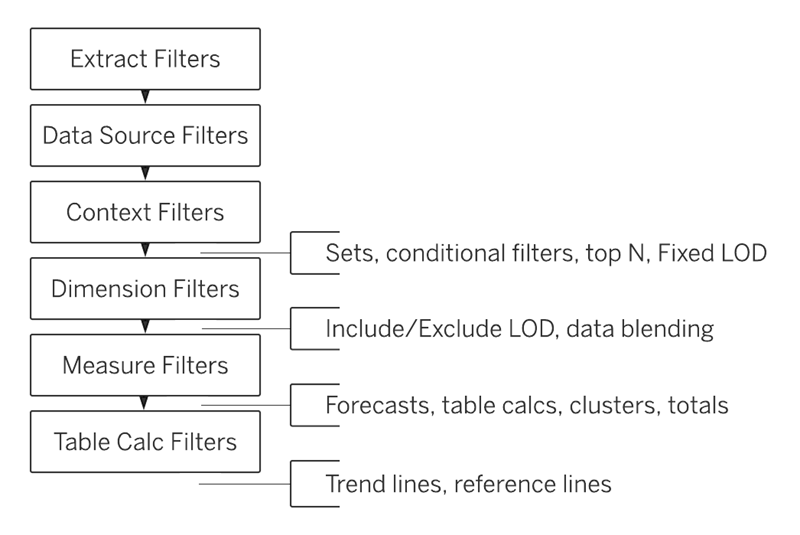
The rectangles in the graphic only represent the order of execution on the different filtering options that Tableau has. As you build your workbook more, you will use the different types of filtering options. Sometimes, these filters might not behave the way that you expect. Furthermore, it is important to consider Tableau’s order of operations and try to work out the hierarchy of filtering actions you have in your workbook.
The lines squeezed in between some of the filtering options represent the other operations other than filters and where in the order of operations they exist. Once the other operations like calculations come in. It is good to know which type of calculations are applied before and after. In most cases, you will have calculations and filtering in your analyses while working with Tableau. To not get confused when Tableau does not present what you expect in this case, refer to the order of operations. To see some examples on why the order os operations is important to consider in day to day analyses, check out this help documentation.
Conclusion
Here were the three important beginner to intermediate level topics of Tableau that every user should grasp an understanding of them. Understanding these topics will make it easier to understand some of the core processes of Tableau much better and allow you to learn more advanced topics easier.
Check out our blogs page to view more blogs on Tableau, Alteryx and Snowflake here.
Work together with one of our consultants and maximise the effects of your data.
Contact us, and we’ll help you right away.