
Recently, I’ve been working on Typhoon data summarizing typhoons for 1980-2016 in south east asia . I thought it would be a fantastic opportunity to learn more about small multiple maps and how to create them. Small multiples are a series of similar charts using the same scale and axes, allowing them to be easily compared. It uses multiple views to show different partitions of a dataset such as years. In this post, we’ll create small map multiples step by step.
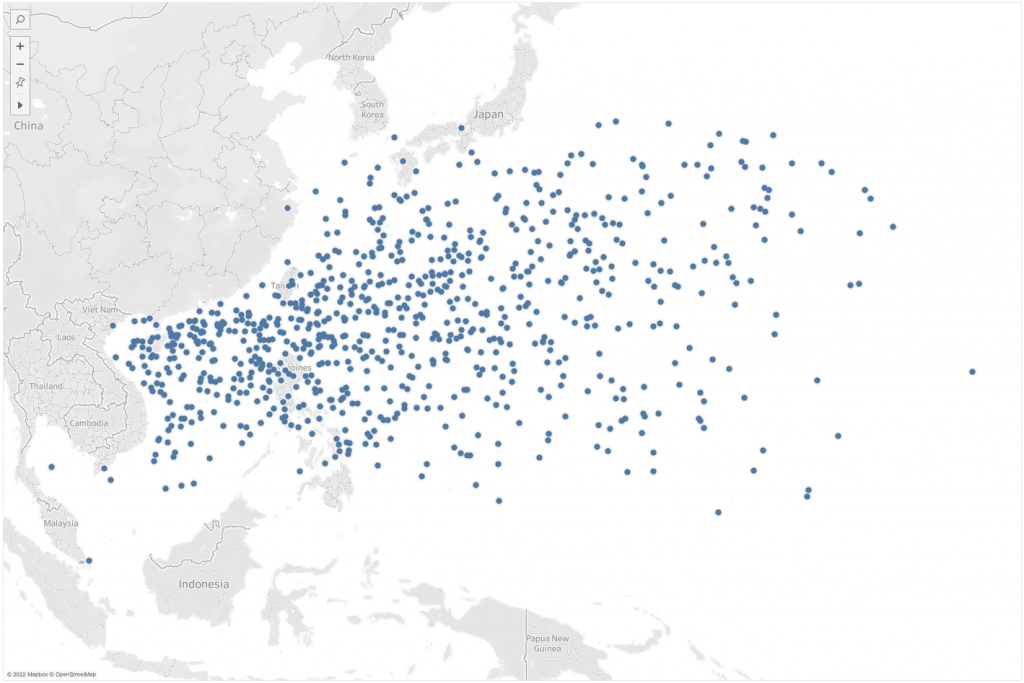
The dataset describes typhoons hitting south east asia along the years of 1980 through 2016. We will start with a generic map visualization to understand what we are aiming at. In the image below we can see all typhoons hitting the area.
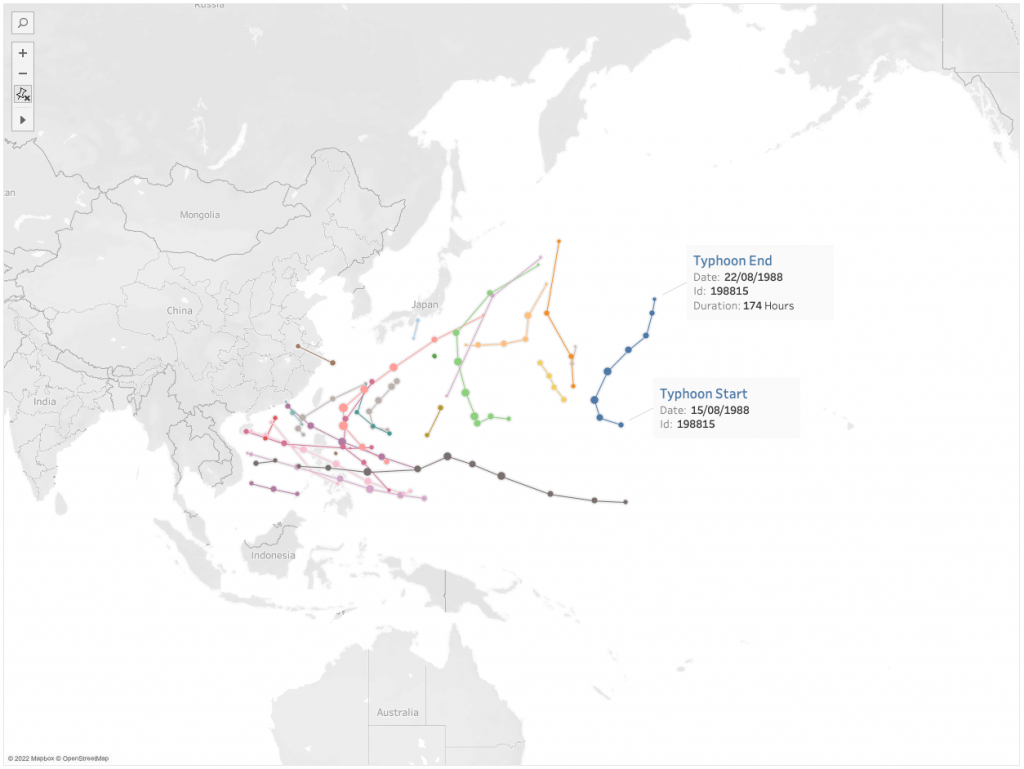
With year 1988 as an example, we can see the underlying records as the typhoon’s trajectory along time from start to end. Our goal in mind is to see typhoons’ trajectories for each year.
Creating our grid
The basic infrastructure for our Small-Multiple maps will be an underlying grid. we will calculate how many columns and rows we need as the basic structure for our small-multiple maps. We would like to have a map for every year for years ranging from 1980 to 2016, which means: (2016-1980) + 1 = 37.
In order to have all 37 maps displayed in our visualization, we would need to construct a grid with 40 cells (5 columns x 8 rows). The construction for such a grid will be based on 3 calculated fields where we basically assign a column and a Row to each year’s map.
- Year Objects:
Ranging from 1 to 37, where 1 represents 1980 and 37 represents 2016. This field will be the basis of our grid and basically index years.//Calculation will index our years from 1 to 37
([YEAR]-1980) + 1 - Grid Cols*:
// Using the Modulo operator (%); 5 is the number of columns([Year Objects]-1)%5 + 1 - Grid Rows:
// We'll devide [Year Objects] to 5 (#Columns), and round to the nearest equal or greater integer
CEILING(([Year Objects])/5)
*The Modulo Method
A very brief walk through calculating the Modulo in our case
- First divide [Year Objects] by the 5 (#Columns)
- Next, take the whole part of the result and multiply that by the 5
- Finally, take the answer in the second step and subtract it from the [Year Objects] to get the answer
For further information about the modulo operator and its uses, you can check out Robbin Vernooij blog: A brief intro to the Modulo operator.
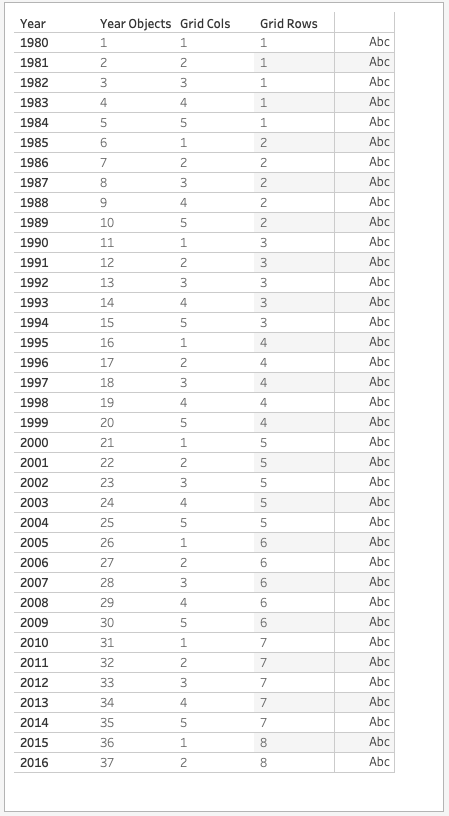
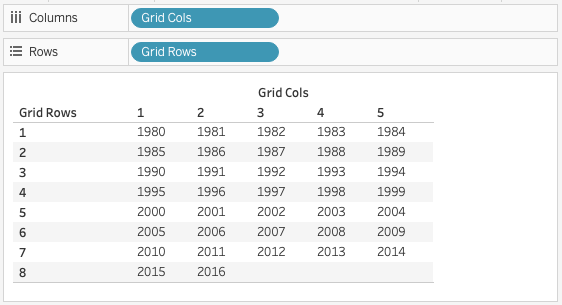
Let’s convert the newly created fields to discrete dimensions and drag [Grid Cols/Rows] to check out our grid. We can add [Years] to Label and populate the grid cells.
Visualization: Map Multiples
Now we come to the moment where all comes into place. First, let’s draw our general map with all Typhoon ID’s for all years.
- Drag [Longitude] to the Columns shelf.
- Drag [Latitude] to the Rows shelf.
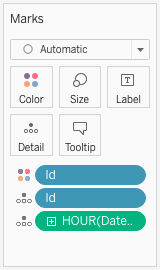
- Add [Id] to Color and Detail and than also adding HOUR( [Datetime] ) to Detail.
In order to create our map multiples, let’s add our grid:
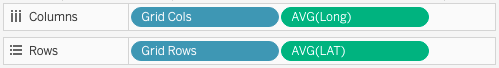
- Add [Grid Col] in front of Longitude on the Columns shelf.
- In the same manner, drag [Grid Rows] in front of Latitude.
- Right Click [Grid Col/Rows] dimensions and uncheck show header to dismiss the grid headers.
Happy Days!!
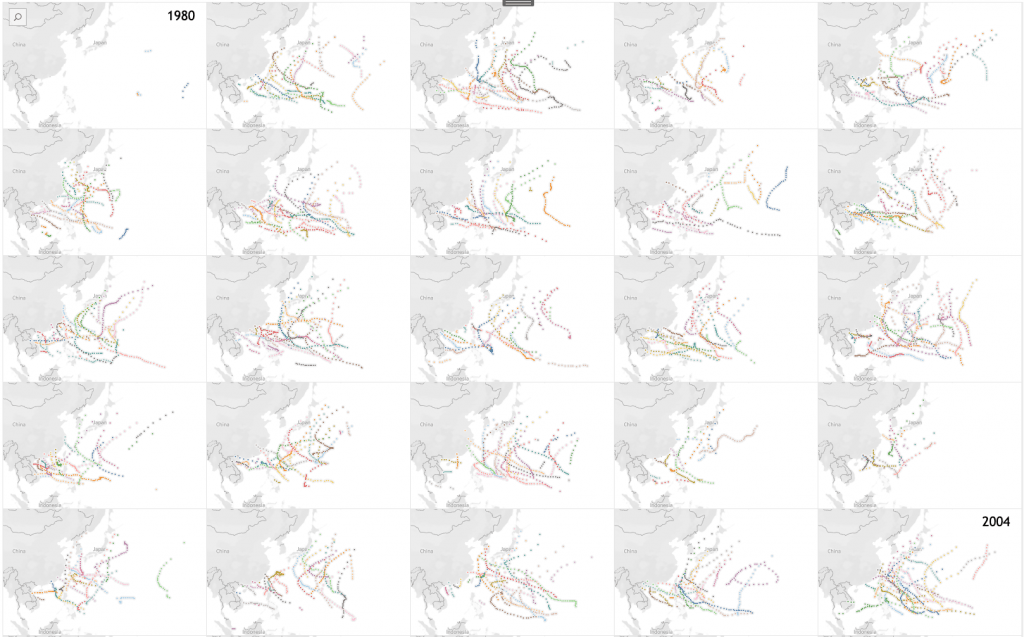
We have our small map multiples. Each year’s typhoons are partitioned within the grid cells. In the image below we can see the end result of 5×5 Grid for years ranging from 1980 to 2004.
Do you need more help or explanation? Don’t hesitate to contact us for our workshops and training courses or hire a consultant.
If you want to learn more about The Information Lab, check out our blog or our website.