
Within Tableau, there are multiple ways when it comes to filtering your data. The most intuitive way used by most Tableau users is with the filter shelf on the worksheet. Once Tableau basics are learned, it is fairly straightforward how to use the filters shelf. However, aside from filtering on the view, there is another form of filtering your data from the source. And that is called Data Source Filters. In this blog, I will introduce what data source filters are, show you how to set it up and explain why they are beneficial.
What are Data Source Filters?
As the name suggests, data source filters are filters that are applied to the data source directly. Ultimately restricting the amount of data that you will be working with in your worksheets from the start. They both work with live connections and extracts. As expected, the configuration of this is done in the Data Source tab. Below, I will show step-by-step of how it is configured.
Configuring Data Source Filters
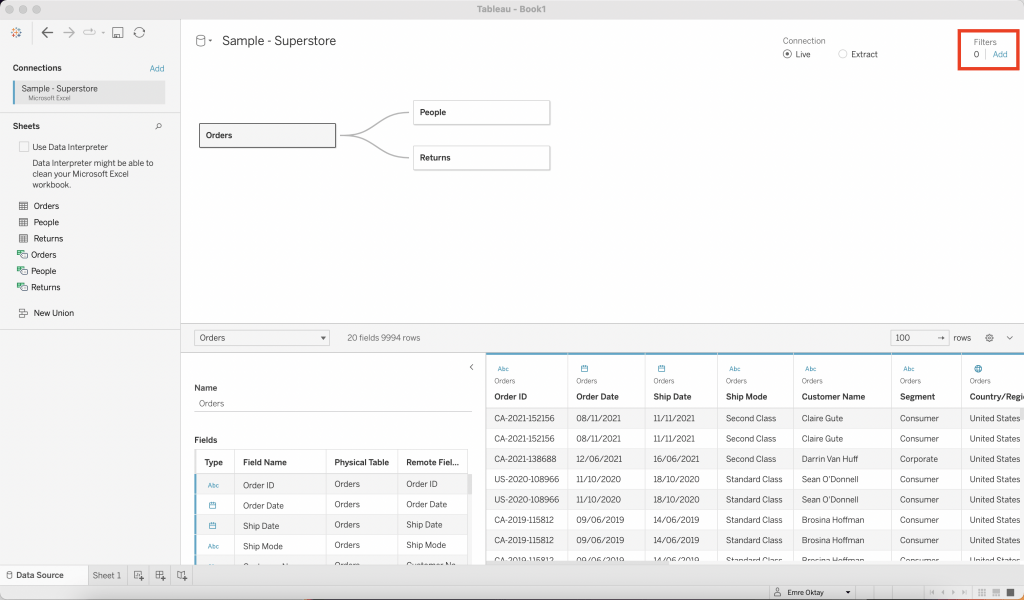
For the example, I will be using the sample superstore data provided by Tableau Desktop. Once connected with your data source, you are greeted with the Data Source page below. The area to configure the data source filters are located in the top right corner of the view. It is a little hidden. Simply click “Add” to set your data source filters.
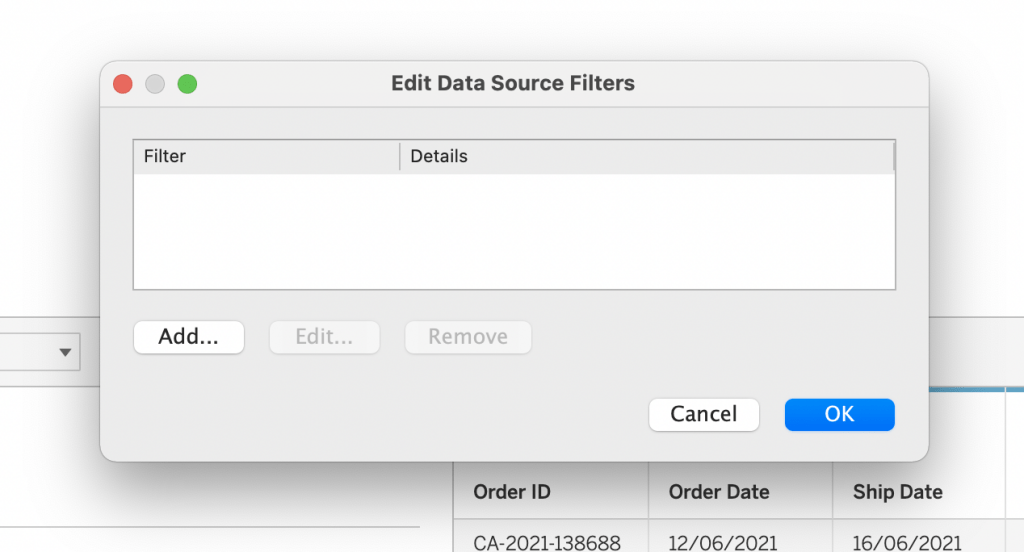
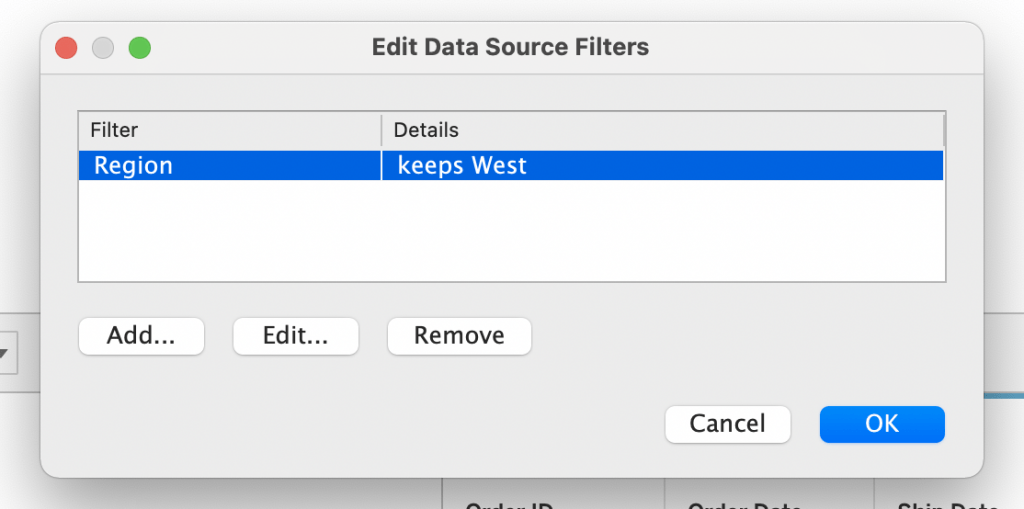
Afterwards, you will be greeted with a pop-up window where you can add, edit or remove data source filters. To add your first one, click “Add” again.
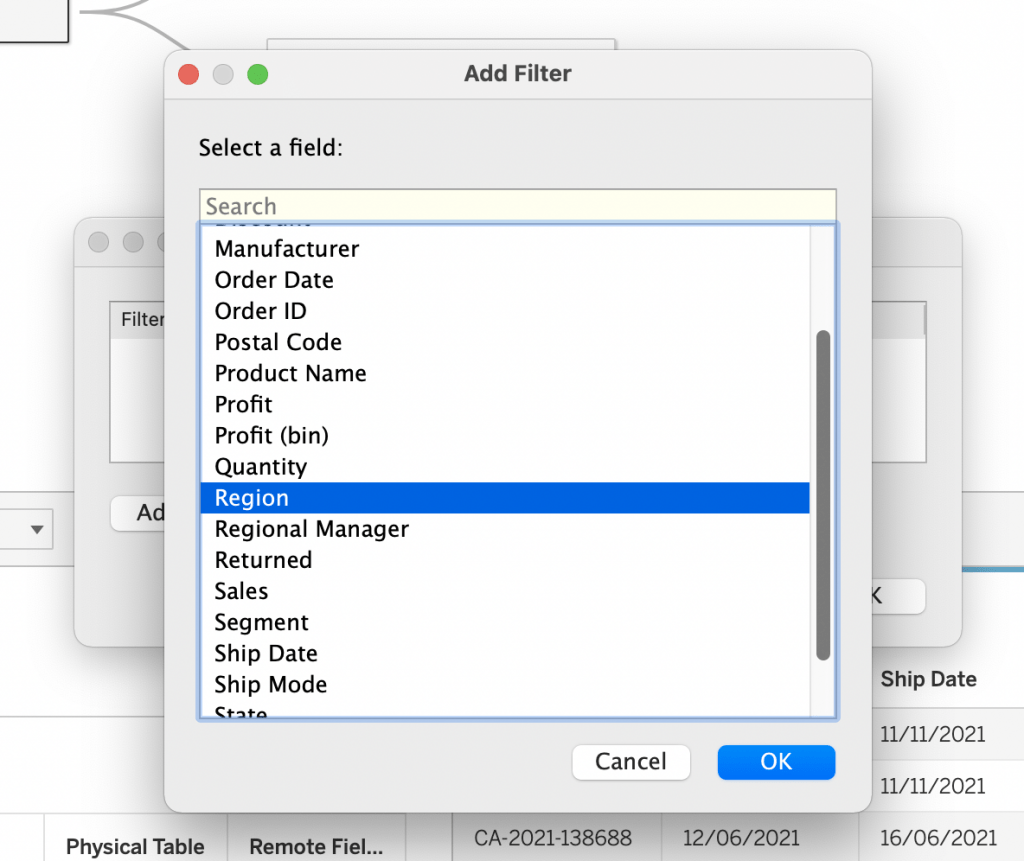
Once pressed OK, you will need to select a field to filter. You can only select one field per created filter. For this example, I am thinking of working only with data coming from the western region of the United States. Therefore, I will be selecting “Region” as my field.
The next step is to configure how the filter behaves. The new window will be the same as a conventional filter configured from worksheets, where filters can be applied with general, wildcard, condition or top configurations. Since I wanted to work with the western region, I will select West only under the General tab.
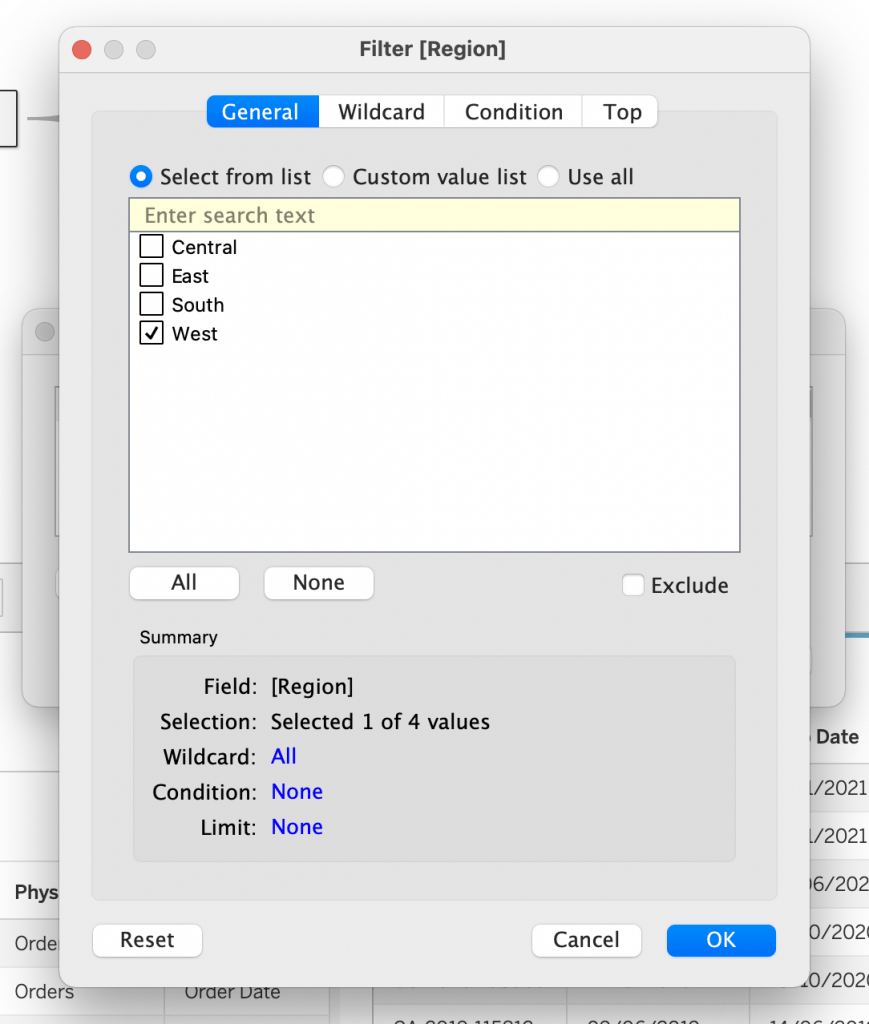
Once I configure what I want and press OK, I am returned to the window where I can see all data sources, this time there is a filter present in there. Depending on my scope for analysis, I can decide to add more filters from this view, remove or edit the existing ones.
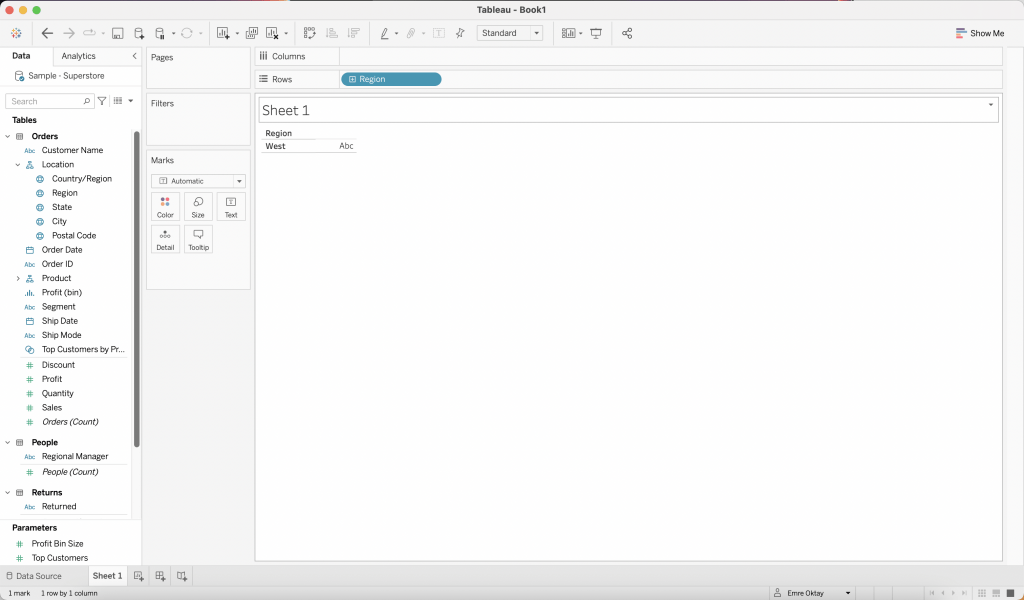
To test if the filter works, I created a new sheet and put “Region” on the rows shelf. As it seems, it is working and I can start my analytics on the western region of the United States only.
Why are they useful?
You might ask what are the benefits to pushing the filters that you apply on the worksheet level back to the data source. There are multiple benefits for filtering your data this way:
- They can be beneficial for restricting data that users can access when the workbook or the data source is published. (Tableau Server)
- When working with large amounts of data, it is useful for defining relevant data to work with from the start. Allowing to work more efficiently.
- They are the second highest level of filter in Tableau’s order of operations. In most cases, they are implemented as subqueries, therefore they can be an effective way of creating a context without using context filters. Since context filters generate a temporary extract which can have its negative effect of performance.
Visit our site The Information Lab NL to see more blog posts, training and consultancy services regarding Tableau, Alteryx and Snowflake.